CMSI 543 / SYEG 557: Welcome to Week 11
This Week's Class Agenda
- Announcements
- Personal Software Process [PSP]
- Earned Value
- COnstructive COst MOdel [COCOMO]
PSP — Personal Software Process
One of the most interesting dichotomies of the software development process is the cost and schedule estimation task. Any software project of reasonable size (i.e., beyond the "toy" application category) must be managed, in order to track progress, anticipate risks, and handle problems effectively. The goal, of course, is to produce quality software, which is defect-free [or as close as is possible], and which is delivered to the customer on schedule and within budget. To accomplish these project management objectives, the software project leader is likely to be given the job of estimating what is needed, in terms of cost and schedule, to successfully complete the project. The result of the estimate is then used in all subsequent project management tasks.
The problem with this methodology is two-fold. First, there is really no effective way to perform this estimation task in any way that is fundamentally different from the stated philosophy; it must be done early in the project, rather than late, for obvious reasons. Secondly, and perhaps more importantly, the estimation process comes so early in the project life cycle that it is nearly impossible to make accurate estimates; not enough information is known at this early stage about the architecture, the design, the requirements, or much of anything else about the project to be able to perform truly accurate project estimation.
Consequently, much time and effort has been spent, and much research done, into methods to improve the accuracy of the early estimation process, and to provide software project leaders with new and effective tools to perform the estimation. One of the best known of these, called "COCOMO" (which stands for "COnstructive COst MOdel") developed by Dr. Barry Boehm of USC. COCOMO and its successor COCOMO II are pretty involved, although it has produced very good cost and schedule models. Further, it is waterfall-based, and thus it is not appropriate for us to learn as part of this course. Feel free to check it out on your own at this site, or any of a host of other locations.
Another method, which is the subject of this week's class, is the "Personal Software
Process" or PSP, developed by Watts
S. Humphrey of IBM and Carnegie Mellon University. The PSP is designed to help software developers
use good engineering practices to plan and track their projects, to use a well-defined process which
incorporates metrics, and to track their performance over time using those metrics. PSP aids software
engineers in managing software quality by analyzing the results of each task, using those results to
continuously improve their software process. PSP is actually pretty easy to follow since there are
a large number of scripts
and templates
to help you, and over time it can provide you
with substantial benefit in improved accuracy of your project estimations. PSP has been adopted by
the SEI and feeds into the CMMI processes very nicely, as we'll see. It has several levels, each
of which is more involved than the previous, but even the lowest level can help you with your
estimation tasks. We will focus on this basic level in class today.
So, To Business . . .
The Personal Software Process is:
- A disciplined, data-driven approach
- A way to apply CMMI principles
- Focused on single developer
- Method for improving planning skills
- Method for improving estimation skills
- Method for reducing defects
The PSP was originally created by Watts Humphrey, who wrote the book "A Discipline for Software Engineering". The book provides all the charts, information, templates, methods, in short, everything you need to learn and use the PSP. In that regard it is similar to the UML book, "The Unified Modeling Language User Guide, in that it is sort of the "bible" for its subject material. Watts Humphrey joined the Software Engineering Institute in 1986, and led the software CMM development there. The book wasn't published until 1995, so he had plenty of time to develop his methodology.
The PSP was subsequently taken over by the SEI and was integrated into the CMMI processes and the related philosophy. There are lots of course materials available for download for students from the SEI/Carnegie-Mellon website.
Why Do We Need Another Method?
As more modern technology relies on software, software projects are getting larger. For such large projects, it is estimated that over half of them are delivered significantly late and over budget. Indeed, nearly 25% of them are cancelled without ever being completed!
Somthing else to consider: even the best software engineers and programmers make errors. These bugs may be difficult to find, and if they make it into production code they are even more expensive to fix. There is a noticeable decrease in productivity when finding and fixing defects in large programs, due to their complexity. Here's some graphics to illustrate:
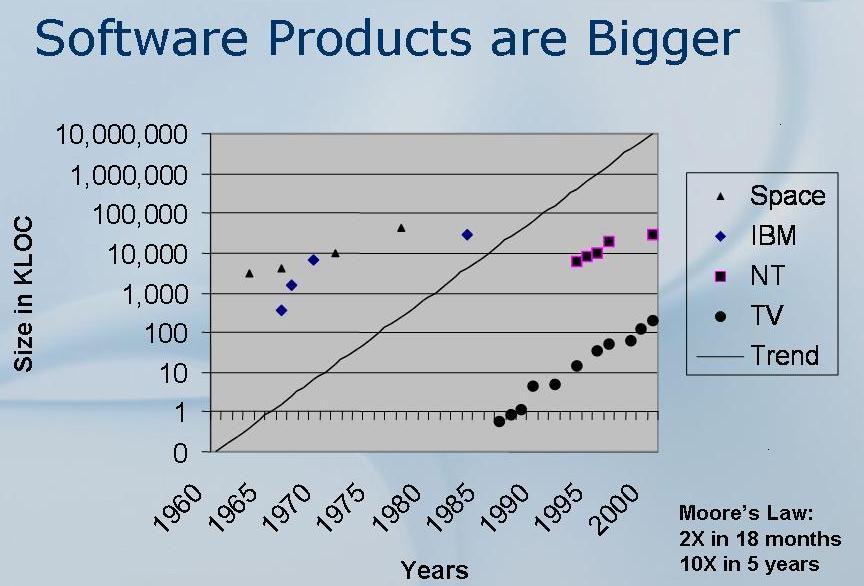
Copyright © by Carnegie Mellon University
Yeah, But What Can PSP Buy *ME*?
So that's all fine and good, but why should you spend time to learn about this "PSP" thing? Will it really do any good for me as a programmer, in my first job, right out of college?
- Insight into YOUR process
- Ideas for process improvements
- Framework to implement your improvements
- Control over YOUR process
- A sense of accomplishment
- A sense of improved teamwork
The PSP matches up very will with the CMMI Process Levels (see diagram below). There are several levels of implementation, each of which is based on the levels below it. The philosophy is based on real world metrics; moreover, it's based on YOUR OWN real world metrics providing you with effective measurement and feedback data. PSP covers all parts of the software development process, including:
- Planning, estimation, and design
- Coding and review activities
- Testing and "post-mortem" metrics
The cool part of the philosophy is, there are scripts to tell you what to do, and templates to tell you how to do it. Every activity has a matching script, or section of a script, and every template matches up to an activity at each level. There are also forms to help you track progress, making the PSP a good tool for basic project management tracking during development.

Copyright © by Carnegie Mellon University
The PSP Levels — What's In There?
The following lists provide some general information about each PSP main level:
- PSP Level Zero (The Baseline Process Level)
- This level starts with your current process
- You use a phased approach for each activity
- You add timing for each activity, recorded on a time sheet template
- You add defect recording for compiling and debugging, recorded on a defect recording sheet
- In level 0.1, you add coding standards and defect type definition standards
- PSP Level One (Personal Planning)
- This level starts with PSP Level Zero
- You add test reporting, like your test plan and test procedures
- You add size and resource estimation, in terms of LOC and minutes per phase
- In level 1.1, you add task and schedule planning activities
- PSP Level Two (Quality Management)
- This level starts with PSP Level 1.1
- You add design reviews
- You add code reviews
- In level 2.1, you add design completeness measurement activities
- PSP Level Three (Cyclic Development, Team Software Process)
- This level starts with PSP Level 2.1
- You use a divide-and-conquer approach, much like AGILE or SCRUM
- You use functional decomposition to define cycles
- You then use full planning, tracking, metrics, etc. activities for every cycle
- This is equivalent to CMMI Level 5, the highest level
OK, Give Me An Example
To get started with PSP, evaluate your current process. It might be something like the following steps:
- Get some requirements
- Think about them for a while
- Maybe make some working notes
- Start coding and do some debugging on each module
- Integrate the modules
- Test the product some
- Release the product
- Write some documentation
- Fix bugs forever
The first thing you'll do with PSP is figure out this process of yours, make it into steps like the above list, then fit it into boxes in the following diagram. The result will be PSP Level Zero for you to start with as a baseline.
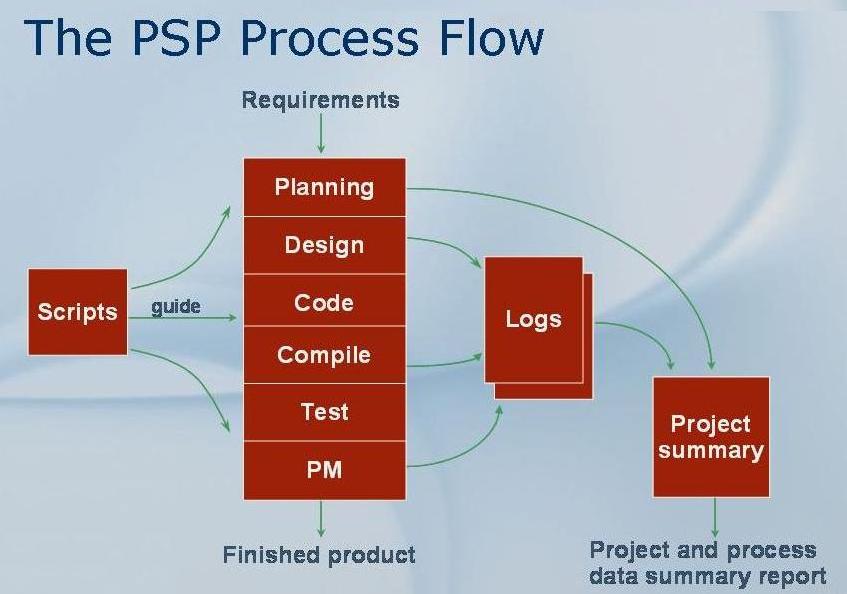
Copyright © by Carnegie Mellon University
The next thing to do is to start planning your project. As with most estimation methods, the whole thing is built on counts of "Source Lines of Code", also called "SLOC". For a large project, the count might run into the thousands of lines, so they are grouped by the thousand into "KLOC" for convenience. The reasoning is that lines of source code are a discrete measure of the amount of code needed for a project, that all programmers require a certain amount of time (on average) to produce a line, and that the number of lines per hour can be used in the estimating process to determine the project's required duration. It turns out there are variations on this theme, but it does hold in the main.
There are LOTS of LOC counters available, some for a price and some for free, or you can write your own. Whatever you do, the thing to remember is to be consistent. It doesn't much matter which tool you use, as long as you use the same one all the time.
For the first time you use the PSP, you won't have any historical data to use, and probably no LOC count to draw on, and maybe only a vague idea of how long things should take. That's OK, because those things are what this whole PSP jazz is about. The first time, just give it your best shot. The process will improve over time, and you can take it on faith your estimates will, too.
OK, Wait, I Lied . . .
Right, sorry, the VERY, VERY first thing to do, is to get a copy of the PSP "scripts" for the PSP Level Zero process, which tell you what to do in a step-by-step way. Read through them fairly carefully, so that you'll have a general idea in your mind of what will be done. You can always refer to them again later — actually, you probably *will* be re-reading them several times during each project. For PSP zero, there are only four of them, and they cover the process itself (Process Script), the project planning phase (Planning Script), the development phases (Development Script), and finally the Postmortem or project wrap-up phase (Post Mortem Script).
Recording Is The Key!
Now back to our regularly scheduled program . . .
The next item of business is to start recording things. Get a copy of the Time
Recording Log (TRL) which looks like the following diagram:
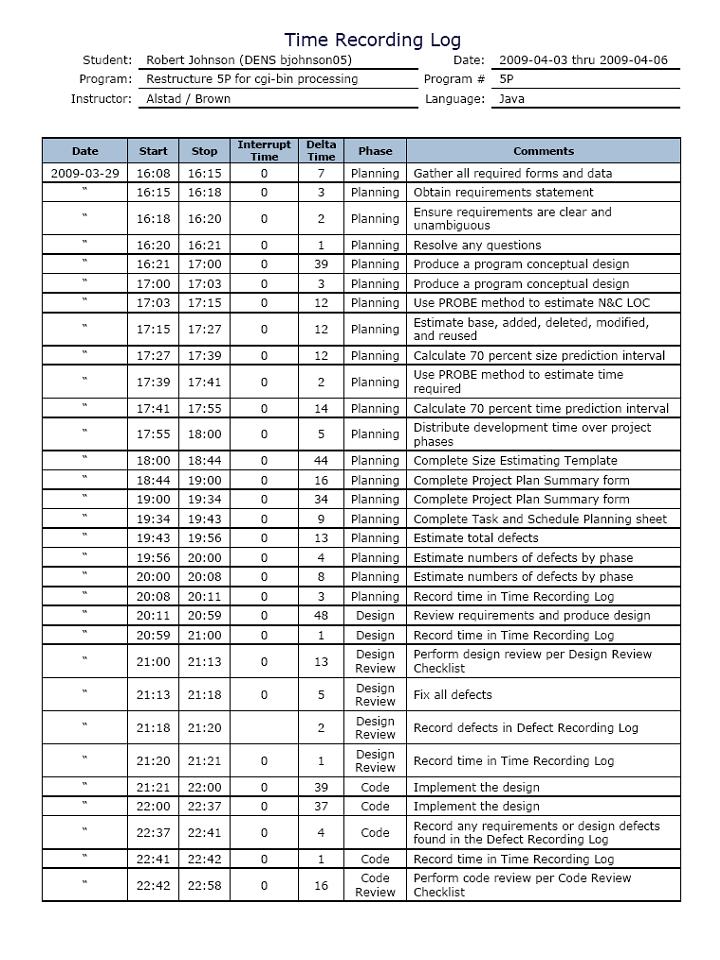
Whenever you do any activity during your engineering session, write down the activity, the phase during which it occurs, and the start and stop times for that activity. Don't worry too much about granularity of the times at first, that will come later. Just try to write down what happens and how long it takes. Keep this sheet handy, either in hard copy or soft copy, every time you are working on your project. YOU WILL LOG EVERYTHING!! Keep track of preparing your forms, downloading things or looking up code on the internet, break times and interruptions, I mean everything. As programmers, we don't usually work this way, but try making this a habit; whenever you sit down to your keyboard, when you are doing desk work on your design, just basically any project-related activity that you do, log your time. Think of this time data as the data you'll be using in later projects to improve the accuracy of the estimates for those later projects.
The next part of the process is to try to plan how long you think each phase of the project will take. The catch is, the time needs to be estimated in minutes for starters. Everything in the PSP gets based on minutes as the individual time unit. From that baseline come all other measurements and calculations for this and all future projects. Start with how long you think it will take you to do the preparation and planning activities. Move on to the design phase, then to coding, compiling, testing, and finally the postmortem phase, making estimations for each. Note that in this methodology, coding and compiling are done separately. This sequence is something that is also hard to get used to doing. Usually we code a little, then compile it and get the compile bugs out, then check it out. However, the PSP tracks compilation separately, so as to facilitate identification of syntax and other compile-time errors when defects are recorded. Coding errors are identified during later levels of PSP and are not tracked for PSP zero. This means you will write all the code at once, then compile it and log all the defects, and only then will you fix the defects. You also have to log any extra defects which are introduced as you fix the defects from previous compilations. All this is explanation of the fact that you track times for coding and compilation separately.
Next up is the project design phase. This is the time when you identify classes, functions, and other program pieces which will be part of the implementation, and produce associated documentation for that design. The focus is on a detailed design. Don't forget to log all time spent in the TRL. Once you have a design, finally you get to code!! YAY! This is what we've been waiting for. However, remember what I said before about typing in ALL the code at once.
Now, compile the code, and write down any defects. Yep, you guessed it, there's a
form to fill out for defect management which looks like this:
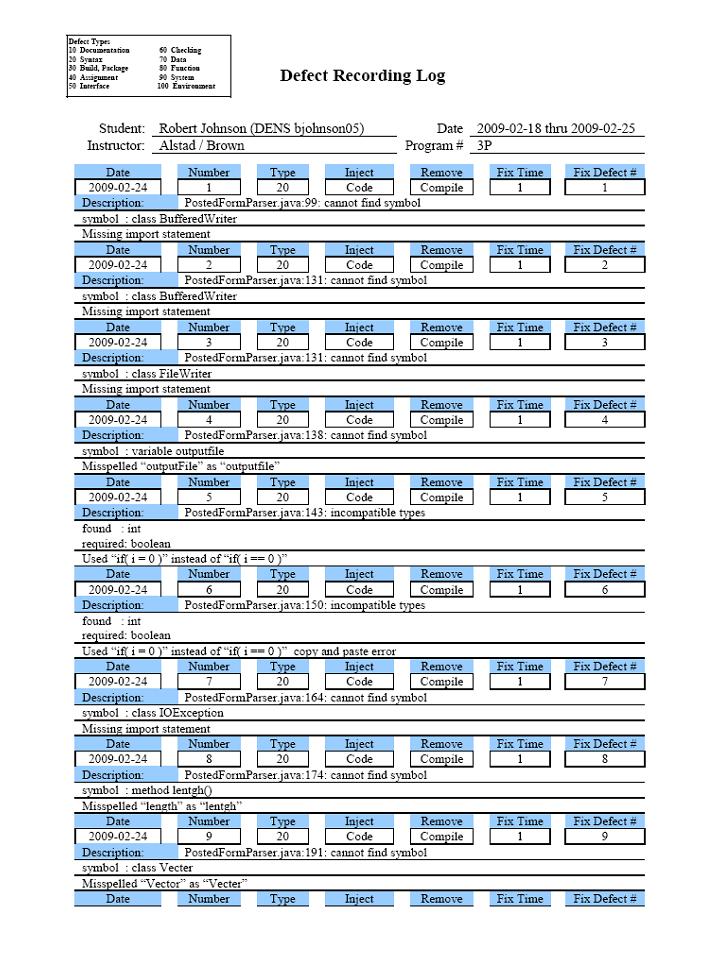
When everything compiles cleanly, it's time to test the application. If there are
problems revealed during testing, they get logged on the defect sheet prior to fixing them. Don't
forget to include the appropriate codes and other information in the fields provided. Errors found
during this phase are usually logic errors rather than syntax or semantic errors, so log them as
such for later. When everything works correctly you're ready for the postmortem
phase, which involves adding up the total time for each phase and entering the values in the final
form, called the Project Plan Summary. It looks like this:
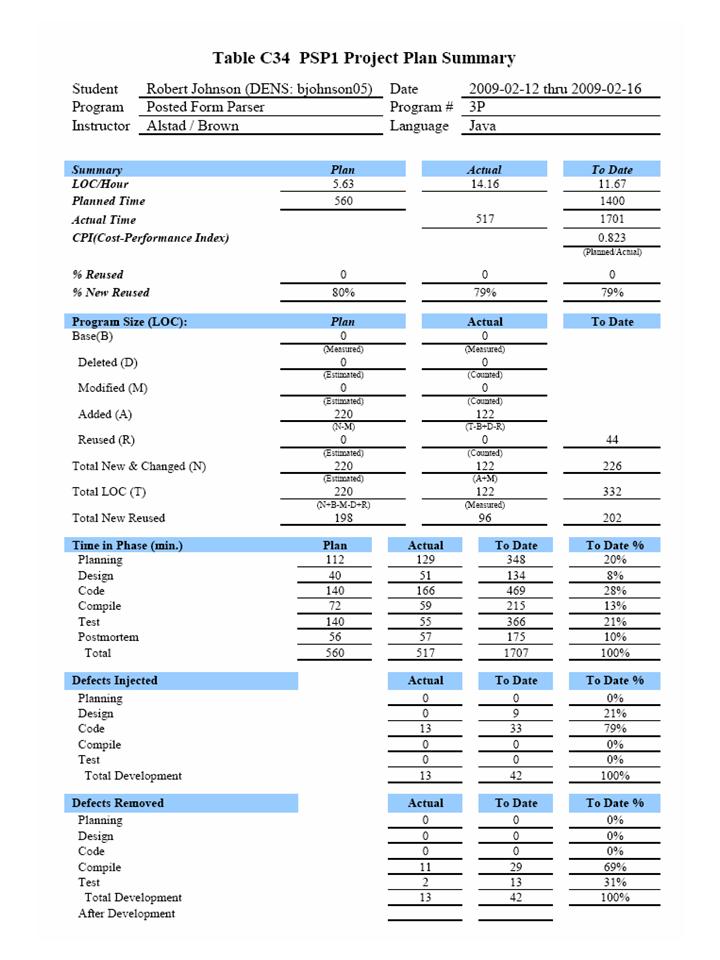
Yeah, So How Does This Help Estimating?
The real payoff from all this is in successive projects, and the estimation you can do; rather, the increase in the accuracy of your estimates on later projects. When you have kept track of all this stuff for three projects, you can start applying linear regression to the data. that way, when you know the number of lines of code you can produce per hour (on average), and have a set of data which shows how far off in the estimation your projected LOC count has historically been, you can adapt your estimates and get really close to the reality.
In the PSP, the estimations are based on divisions of code types, and use a method called
"PROBE" which stands for PROxy Based Estimation.
It uses a table of different types of modules, categorized by size from very small to very large.
A typical PROBE table looks like this:
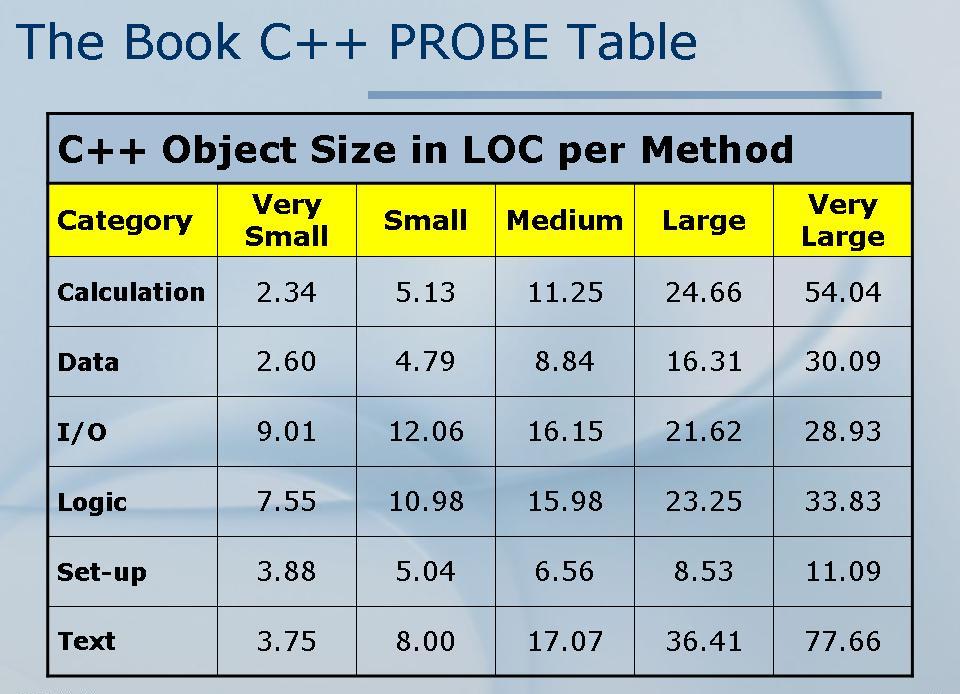
As you can see, this table is for C++ code, which can also be used for Java code. The values are from a historical record of many projects in which Watts Humphrey participated, and he based these entries on statistical analysis of those projects so they are expected to be pretty accurate. You can use the values to determine approximate LOC count for each size and category.
The method for using PROBE is to do use the values during the design phase, once you have determined all your various modules, classes, functions, and so on. Figure out which category and size box into which a particular module fits, and that gives you the estimated LOC count for that module. Add up all the estimations, and use that for the total estimated LOC count for the project. This number is then entered into the appropriate location on the PPS. As time goes on, you can add your own categories and size figures, once you have done enough projects to provide data (usually three projects at a minimum). Once you know a total projected LOC count, you can use your typical count of KLOC/hour to figure out total time required, then use the percentages to determine the ballpark time estimation for each of the phases of the project.
. . . And, Voílá!!
That's the nuts and bolts basics of the Personal Software Process. I have used it in a couple of my projects since taking the class at USC, and have found it helpful for estimating time and LOC in most cases. There are a couple of things to be aware of, like the difference between logical and physical lines of code, and the difference between object size in different programming languages, but the basic method works effectively once you get used to doing the "extras" that the process requires. Also, if you get a job after graduation at a software company that follows CMMI level processes, you will likely be required to do something similar to this method. Now you know!
At first blush, this is obviously something that is in line with Waterfall. That is because it was first developed while using Waterfall development practices. However, this does NOT mean it can't be adapted for use with Agile. Since Agile uses the same main activities as any other software development method, it is easy to see how this entire process can flow into an Agile project. There are a couple of caveats to be considered, though:
- This process is, at first, VERY heavy-weight. There are lots of forms and scripts to download and fill out.
- The process requires that you track your progress for every iteration; this can significantly slow down the development for the first few iterations while you get up to speed
- PSP requires that you be able to accurately count and keep track of the lines of source code, which is referred to by several different names: LOC or Lines of Code, SLOC or Source Lines of Code, KLOC or Thousand Lines of Code, and SLOC count or Source Lines of Code Count. They all mean essentially the same thing, except for KLOC in which the count is in thousands of lines.
- Counting LOC requires a separate tool, since this is a count of Executable Lines of Code and not just the line count of the source file. Comments, blank lines, and lines with a single curly brace are discounted, and continuation lines are counted as a single LOC.
- Part of the process is to measurably improve as time goes on. There are several different levels in PSP, all of which require at least what is included in PSP0, and moving up the scale. Refer back to the diagram above for more information
- Finally, as can be seen from the filled out templates above, there are some activities which require very detailed time recording, and some that are not so detailed, so there is some inconsistency.
Earned Value — Tracking How You've Spent Customer Money
Earned Value can be important in helping project management measure project performance and progress.
The systematic process which is used to measure project performance against cost and schedule, and to
find variances by comparing planned work with what has been accomplished, can show project managers and
customers that they are getting the planned-for value for their money. In fact, calculating the Earned
Value of a project can show the 30,000-foot view
of the actual project to the project schedulers,
project controlers, and project managers in an organization. It allows them to monitor the project
scope, actual and budgeted costs, and project performance. Knowing this information can help interested
stakeholders make needed adjustments to the project strategy and perform in-depth analysis of the
project budget.
There are quite a few earned value formulas which may be applied in the various situations during any project that can help determine if the value of the project is equal to the current costs. The following list provides top-level information on some of the most-used formulas.
- Planned Value [PV] — Planned Value is the approved budget for work scheduled
to be completed by a certain date. In comparison with Earned Value, PV is a proactive planning
calculation that shows how much should have been spent to a certain date in the project development.
Planned Value is also called Budgeted Cost of Work Scheduled [BCWS].
To find the Planned Value at some point, add up all planned costs up to that point in the project, as referenced from the project's baseline. - Actual Cost [AC] — Actual Cost is the real total cost for the work performed on specific activities during a certain period of time. It shows the money spent. Actual Cost is also called Actual Cost of Work Performed [ACWP]. Actual Cost will increase gradually as the project progresses.
- Budget at Completion [BAC] — Budget at Completion is the total of the ALL of the sub-project budgets that are expected to be spent. It shows how much money was initially planned.
- Earned Value [EV] — Finally, Earned Value is the amount of the work that is
actually completed at any given ponit, shown as the value of the performance budget which
has been assigned to that work. It is calculated as the Budget At Completion (BAC) multiplied by
the Percent of Work Completed:
EV = BAC x % CompleteFor instance, if the actual percent complete is 30% and the budget is $10,000 then EV is $3,000:
EV= $10,000 x 30% EV= $ 3,000 - Schedule Variance [SV] — Schedule Variance shows the difference between
planned schedule and actual schedule. It tracks whether the project is behind, ahead, or on the
money. Schedule Variance is calculated as a difference between Earned Value and Planned Value:
SV = EV - PVThe project is running late [behind schedule, slipping to the right] if SV is negative. For example:
EV = $3,000 PV = $3,500 SV = $3,000 - $3,500 SV = - $500 ← Uh-oh… - Schedule Performance Index [SPI] — Schedule Performance Index shows the rate
at which the project performance is meeting expectations. It a measure of efficiency of the project.
SPI is calculated by dividing Earned Value by Planned Value.
SPI = EV / PVThe task is behind schedule if SPI is smaller than 1.
   EV  = $3,000
   PV  = $3,500
   SPI = $3,000 / $3,500

   SPI = 0.85   ←  Uh-oh…
In this example, SPI is 0.85, and the task is 28% behind schedule.
It is interesting to note that many managers of Waterfall projects view a POSITIVE SPI as just as bad as
a NEGATIVE SPI. This is because if you are AHEAD of schedule, it means either your schedule is out of
whack, or your estimates are out of whack. If you are BEHIND, obviously that's bad. But if you are
AHEAD, that means you are spending less budget than you thought the task would take. Managment sees this
as an indication that you may have padded your estimate
or that the customer may be paying too
much, which can cost the organization future business.
COCOMO — COnstructive COst MOdel
& COCOMO II, too!
The Constructive Cost Model method is another way of doing software estimation, which was developed by
Dr. Barry Boehm at U.S.C. in the late 1970's. The model helps estimate effort, cost, and schedule for
software projects, drawing originally on a large number of software development projects at now-defunct
TRW Aerospace. Using projects ranging in size from 2KLOC to 100KLOC, Boehm built a model that considers
the product attributes, hardware attributes, personnel attributes, and project attributes of what is
being developed, and applies a formula to calculate the overall effort. A total of 15 attributes in
those four categories are rated on a six-point scale from very low
[value 1] to Extra High
[value 6]. Once the ratings are obtained, an Effort Adjustment Factor [EAF] is applied
to each of the factors. Finally, the KLOC estimate is raised to a power based on one of three types of
software project categories [organic
, semi-detached
, or embedded]; that result is
then multiplied by both the EAF and another calculated coefficient value to produce the effort value of
the project.
The four categories that are used to determine the cost drivers
in the COCOMO model are:
- Product attributes including:
Required software reliability
,Size of application database
, andComplexity of the product
- Hardware attributes which comprise:
Run-time performance constraints
,Memory constraints
,Volatility of the virtual machine environment
, andRequired turnabout time
- Personnel attributes which includes:
Analyst capability
,Software engineering capability
,Applications experience
,Virtual machine experience
, andProgramming language experience
- Project attributes including:
Use of software tools
,Application of software engineering methods
, andRequired development schedule
- Personnel attributes which includes:
If this all sounds complicated, guess what... it is! However, it's easier to see what all this means if you can see the published tables.
COCOMO and COCOMO II have been used for a number of years in Waterfall projects of all kinds, and they
produce estimates that are moderately accurate for most projects. However, most of the data comes from
what are known as monolithic
applications. It is much more difficult to get an
accurate estimation on a distributed system, in many cases, because of the variety of different things
that are running, the differing platforms on which they execute, and the fact that debugging them takes
such a lot of effort [it's not impossible, but is notoriously hard]
Because COCOMO doesn't lend itself all that well to Agile projects, we won't cover it further, but you should know what it is, and the basics of what it does so that if/when your boss in industry asks you to use it you'll know what is being requested.
A Brief Intro to UML
The Unified Modeling Language, or UML
is a standardized way of showing a system using specific
diagrams. It is another way of conceptualizing a software system, which is a logical outgrowth of the
flowchart
and program logic trees
that were used in the 1980's and 1990's to present these
concepts. To illustrate some of the basic ideas,
here is a link to some pages that explain some of the
basic diagrams.
At my last count, there are 13 different diagrams included in UML — there may be more than that, but I quit counting. Remember the important point, though: any model is a representation of a conceptualization of the system, and it really doesn't matter too much if you use a dashed line or a solid line, or an open or closed arrow, or a solid or open diamond, AS LONG AS YOU GET THE INFORMATION TO BE UNDERSTOOD!
A Brief Break, Then Project Time
OK, that's just about enough of THAT stuff………