CMSI 401: Unified Modeling Language
A High-level Introduction
Introduction
This page (and the one following, see link at bottom) is a rehashing of the information which is also available in the class notes, and I have added some other stuff, like examples of the different types of diagrams that are (IMHO) the most useful of those available in UML. This page is NOT intended as a substitution for any of the normal methods of learning, namely, reading the book, reading and using the >UML Distilled book, searching the web, or asking Caskey, Dondi, or me. However, it does walk you through a couple of scenarios which may be useful in your design and development efforts.
For starters, go to the week 4 page, which is where we started picking up the UML basics. We started with an activity diagram of cooking rice. You can get there from here.
It is helpful to remember that UML is more than just a bunch of block diagrams. It is really a language, and as such has semantics along with its syntax. As such, you use the main diagram parts as the "syntax", and the attributes and other parts to convey the "semantics". Taken as a whole, UML is really more of a design philosophy than simply a block diagram tool. As such, it has a long, illustrious, and sometimes controversial history. You anthropologist minors out there may enjoy googling some of the development history to find out all the details — a good place to start, of course, is with the "Unified Modeling Language User Guide". This book is the thick version of the Fowler book, and contains large amounts of good information about software design topics in general as well as the particular details of using UML for software design.
Class Diagrams
OK. Here is the Kaleidoscope example in web format so you don't have to go digging around for your Microsoft Office CDs to install PowerPoint. This example came from an old C++ book I have lying around, by Cohoon/Davidson (see the bibliography page for citation).
The requirements for the Kaleidoscope simulation are as follows:
- The kaleidoscope program displays a kaleidoscope image in a window.
- The window should be square 10 cm on a side
- The window should be labeled "Kaleidoscope"
- The kaleidoscope image consists of 3 shapes
- Circle
- Square
- Triangle
- The kaleidoscope should be "turned" once per second so the image is updated
- Each time the kaleidoscope is turned, four new shapes of the same type are added to the image
- Shape centers are located on lines that bisect each quadrant of the window
- Type, size, and color of each added shape are determined at random
- Shapes in diagonally opposite quadrants are the same color
In the book, the authors provide complete and detailed justification for what follows. For our purposes it is overkill, so I've condensed it for your benefit.
To interpret some of the requirements, there will be a window that has a title bar label of "Kaleidoscope". The window will be logically divided into quadrants. There are three shapes, as listed, which will be displayed in the window. Every second, the following will occur (this is a use-case!):
- The system redraws the entire window shifted 90° clockwise (or counter-clockwise, it doesn't really matter). All existing shapes are redrawn.
- The system selects a random shape.
- The system draws four of that shape in the window, one in each quadrant.
- The shapes are drawn such that their centers lie on the diagonals through each quadrant. New shapes are drawn over old shapes.
- The system selects two random colors
- The system colors the two shapes in quadrants 1 and 3 one color, and the shapes in the other quadrants the other color.
This leads up to several important points. For one thing, no matter what shape is selected, it will be drawn into the window. This goes for the label, as well, since the simulation is creating its own window. Thus, there are two classes, shape and label, which will always be drawn in the window. This makes the case for having a top-level abstract class called a "WindowObject." Note that this object is NOT the "window" itself, but is instead ANY OBJECT THAT GOES IN the window.
Next, there are three types of shapes, which fairly screams "subclass of shape!" so there should be three subclasses. The resulting class hierarchy looks like this:

The UML notation for a class, as shown in the diagram, is a block, with the name of the class
represented at the top. The block can include two other sections, separated by a straight
line. The middle section contains class fields or attributes, and the bottom segment contains
member functions (methods, behaviors). Within these two sections, each item has several
distinct characteristics. First, the access of the item, which is denoted with a
"+" for public, a "#" for protected, or a "-" for private.
Next, the type is specified by a type name following a colon; e.g., in
"- center:Position" the type is a "Position" object. In the case of
member functions, the type specifier refers to the return type of the function. Finally,
notice that the member functions that require any arguments list the argument,
specifying its type after a colon, and separating arguments in a list with commas. (We must
assume for this exercise that any classes we don't define ourselves are already defined and
available.)
Now that the parts of the class representation are defined, we can move on to the class hierarchy on the diagram. The small triangle under the class symbols denotes the concept of inheritance; the class above is a "superclass" or "parent", and the classes below (connected by solid lines) are "subclasses" or "children". Subclasses inherit everything from their "parents". In this case, the "Shape" and "Label" classes are "children" of "WindowObject", and the other three classes are subclasses of "Shape". This means that a "Circle" will inherit its "- color" field from "Shape", and its "- center" field from the "WindowObject" class.
It's important to remember that as a modeling tool, UML allows specification or omission of almost all of these parts of a class. One of the underlying tenets of UML is that you only need to show the symbols of a diagram that make the ideas clear. With this in mind, it is perfectly valid UML to only show the class names in boxes, connected by the solid lines or inheritance symbols, without any of the attributes or methods, if the intent of the diagram is only to show relationships between classes at a very high level of abstraction.
Next, here is one implementation of the "Kaleidoscope" class:
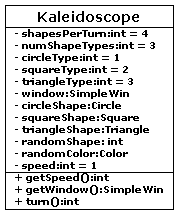
This class has a much richer set of member fields, many of which specify not only their
types, but also their initializers, shown by adding an
" = " after
the type specifier, followed by the initialization value. It is important that these
initializer types match the specified field types.
Now comes the important part of the class diagram, in which we show the relationships of the classes to each other in their "system" environment. For this reference example, all classes needed to show the functionality of the system are included in the diagram, and their interrelationships are specified using solid lines called associations, as shown in the following diagram:
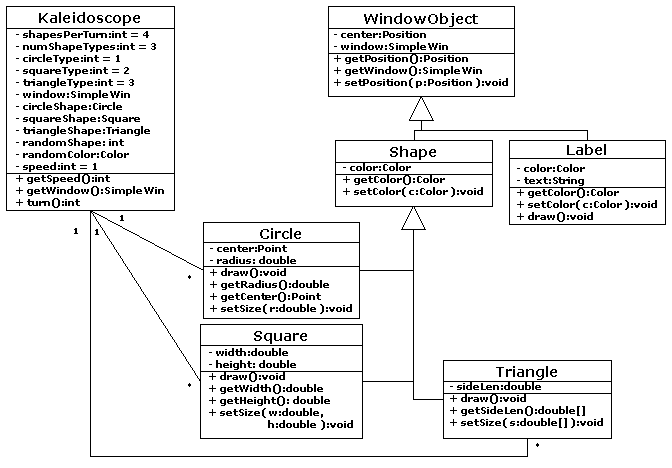
There are several new things to notice about this diagram. First and foremost, there are the associations between the "Circle", "Square", and "Triangle" classes and the "Kaleidoscope" class, shown by the solid lines. These lines are also marked with the cardinality of each relationship, which in this case is the same for all classes. The small number "1" by each of the shape subclasses indicates "how many kaleidoscopes" that shape is allowed to belong to in each instance of this system. For example, every circle object that is created in a Kaleidoscope will only belong to that single Kaleidoscope. The "*" (asterisk, star) on the other end of the association shows how many of each shape class can belong to each Kaleidoscope class. In this case, the star represents "zero or more", meaning that there could be no instances of "Square" in any particular Kaleidoscope, or there could be 100, or 8, or 1000. Cardinality that fits within a range is specified by showing the end points of the range separated by two dots, e.g., "1..5" means anything in the range 1, 2, 3, 4, or 5. These are usually in integer format, but can also be used for continuous ranges and/or decimal precision.
Another thing to notice is that the parts of the diagram have shifted. Subclasses don't always have to be "lined up" below their superclasses. In fact, if it's more convenient in the drawing, subclasses can be drawn over superclasses, with the inheritance triangle going the other way:

Lots of similar reconfigurations are possible, which brings up a good point that Caskey told me about: It is usually helpful to draw the initial diagram on some eraseable medium (a whiteboard, a blackboard, even pencil-and-paper) because drawing the diagram will be an iterative process. You may re-think something that you hadn't planned when you started the diagram, and when you add it things start to look cluttered or "funky-looking"; the association lines may end up looking like spaghetti, or the cardinalities may get lost in the mix. The main purpose of the UML diagram, clarity, may become obliterated. Don't be afraid to make mistakes, erase, clarify, expand, or even throw it all out and start over!!
Next, we might wish to model the fact that every time a new set of shapes is added to a Kaleidoscope window, four of the same kind are added. This could be done by using a constraint on the association lines, as shown below. To help improve clarity in this diagram, only the Kaleidoscope class and the three shapes that are instantiated are shown here:
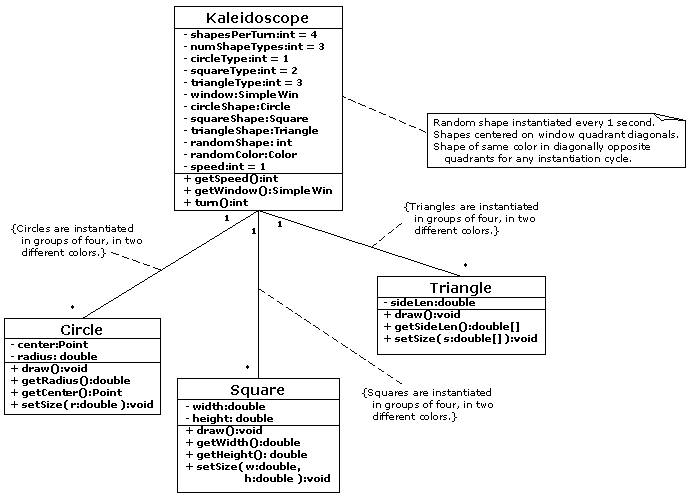
Notice the constraint text for each of the associations, enclosed in curly braces, and joined to the association lines with dashed lines. This allows the diagram to model the necessary constraints of both adding four shapes at a time, and having the two different colors for the shapes created in the window. Also, the addition of a note in the folded-corner block allows exact specification of how instantiations are accomplished by the Kaleidoscope class. Notes also use the dashed-line connection.
You will find yourself using class diagrams often in your designs, since they are the "backbone" of Object-Oriented Design. There are many more symbols defined for classes in UML, such as:
- Stereotypes
- Scope operations and attributes
- multiple and dynamic classification
- aggregation and composition
- derived associations
Sequence Diagrams
Class diagrams are a static
view of the system. However, if you want to show how the system
operates, you need a dynamic
view. The following example will show you what that meand. Note
that this diagram is in an
article
which talks about a tool for responding to security incidents, and is derived from Netflix' Security
and Incident Response Team's (SIRT's) description of their tool. This shows that UML is not, in fact,
an entirely dead language, since this article is dated from July of 2018.