
Now that you are familiar with the concepts of what UML is for and how to do some of the basic modeling, it's time to get into some new concepts. There are four more important types of UML diagram, each of which (of course!) model different views of the system, to clarify different operations of the system. We'll start with the . . .
State diagrams are another method of describing the behavior of a system by showing all of the possible states that the system can be in, and how the states change as a result of events that affect the system. Usually, state diagrams are drawn for a single class, for simplicity of communication, and show the behavior of that class over its lifetime. This is not a requirement, but a usual practice. We all remember Dr. Dorin's state machines in the CMSI 385 class. UML state machines are very similar. They were developed based on the style of the statechart developed by David Harel in 1987.
There are two basic parts to the state diagram. First is the event, which is an occurrence at a point in time. Events are sometimes known as a stimulus, a signal, or even a discrete signal. Events are considered to be atomic, meaning in the usual sense that the event happens and cannot be interrupted by any other event. Examples of events could be "landing gear doors open", "flaps extend from wings", or "engine starts."
The other part of the state diagram is the state representation, or simply the state. This part represents a single situation that the system can exist in over a finite time interval. There is one requirement, that the state of the system be recognizable. There are two special states, the initial state and the ending or final state. The following diagram shows a state diagram for a microwave oven control:
As shown in the diagram, the initial state is shown by a solid black circle. This state doesn't require any event to transition to the first box. The first real state of this system, then, is with the door shut, and presumably with the oven empty. The other states that the system can inhabit are "door open", "door open with item", "door shut with item", "ready to cook", and "cooking". When events happen in the system, they cause transitions in the system between these different states. Events are attached to the transition lines of the state diagram, and are numbered to show their sequence. Numbers are assigned using a "dot" notation, so that major steps come first, and "sub-steps" of those steps are shown by using the major step number followed by a dot, ending with the minor step number; this is much like software version numbers.
It is possible for events to happen which do not cause the system to change state. These are sometimes known as activities, and are shown inside the block of the state they are associated with. Observe the "cooking" state in the drawing; the two steps labeled "Entry" and "Exit" refer to steps which start and stop the cooking process. These two steps are part of the cooking process, are (presumably) delegated to the cooking subsystem, but are not truly "events" in the UML sense. Thus they are not assigned to any event transition line, but are instead shown inside the "Cooking" state. An activity is NOT considered to be atomic in nature, and may be interrupted. Interruptions may cause the system to change states so that the activity is incomplete.
In this particular view, not all the steps are shown, since this representation shows only a "kernel" view of the microwave's operating system. However, enough steps are shown to enable a user to determine the operational flow. For example, steps include opening the door (1.1), placing an item inside (2.1), and closing the door (3.1). Note in step 3.1 a constraint has been shown (in square brackets) to indicate that the event is specific to the case in which there is no time shown/entered on the timer.
Following the steps in this manner reveals the processing that the system must go through to perform the task (solve the problem) of cooking food. It also shows there are steps that are missing in the numbering sequence. This is because the diagram is only part of a set, which models only one of the microwave's subsystems. However, the omissions also reveal top-level assumptions about the system, knowing that all the steps must be accounted for. Thus, the reader may assume that the omission in this diagram of any steps numbered "4.x", coupled with the idea that those steps would presumably set the cooking time in the sequence of events, points to the existence of a "timer subsystem", whose state diagram would reflect the missing steps.
It is also possible in UML to have states that contain other, smaller state diagrams. In this manner, state diagrams may have hierarchies. Further, there are ways to show systems that may have concurrent states; see the UML Distilled book pages 121 - 126 for details on both of these situations.
One last comment: it is possible for the state diagram to express some final state (which this
microwave system does not have or show). Final states are shown just like in any normal state
machine, using a solid circle enclosed by an empty one
Now, we have expressed systems in several different views, allowing for breaking each view into successively smaller portions so that we may fully and clearly understand what the various parts of the system are/should be, and how they operate. But, what about expressing parts of the system so as to show dependencies between them? This is the job of the Package Diagram.
A package in UML is a grouping mechanism. The idea of a package is simply a group of some or all of the classes of a system into higher level units. The idea can be applied to any modeling element, not just classes. A package diagram allows modeling of groups of classes of our system and the dependency relationships between them. An example based on one idea of an automated test equipment controller appears below:

As you can see from the drawing, there are a number of packages, represented by the things that look like file folders. The package names appear inside the folders. Dependencies between different packages are modeled as dashed-line arrows, as shown. Dependencies exist between two elements if changes to the definition of one element will cause changes to the other, but the inverse is not necessarily true. For example, in a set of classes, dependencies may exist for several reasons:
In all of these cases, it may not be necessary to change the "One class" if there are any changes to the "other class". This is why the dependency is modeled with the arrow shown going from the package that is dependent to the package it depends on. In other words, the "head" of the arrow goes next to the package that is being depended on.
In the diagram above, the Measurement Performance package is dependent upon the Spacecraft Configuration, the Test Equipment Control, and the Special Conditions packages. All three of these packages are dependent, in turn, on the Environment package, which depends on the Test Parameter Data Base Handlers package. The Data Reduction package depends on the Measurement Performance package, and is depended upon by the Data Output package. These dependencies indicate, at a high level of abstraction, that there is at least one class in the Data Output package, for example, that must change if a change is made to one or more classes in the Data Reduction package. The entire package (meaning every class contained in the package) may not be dependent on the change, although this is also a possibility in some cases. Also, packages can be comprised of packages, so hierarchies can develop in the model; Also, there are ways to indicate if a part of a package has dependency to a second package, and a different part of the first package has dependency on a third package. Also, the contents of the package can be shown by putting the package name in the tab, and using the internal space of the package folder to list the package contents. See the literature for further details.
Packages can be of significant use in large projects, whenever a class diagram begins to include so much detail that it becomes illegible or can no longer fit within the size constraints of the display medium (like a hard-copy printout). Also, the testing process can make very good use of package diagrams to show what system parts are being tested. Each package could have its own test suite, which performs all the testing for its package. Classes that are added to the package may only need their unit tests to be added to the one test suite for that package.
Having looked at modeling from the "macro" level, let's move back to the "micro" level for a moment to look at an Activity Diagram. This type of diagram allows the modeler to show the order of operations for the activities of the system. It is an abstraction which states the essential ordering that must be performed to correctly solve the problem. It is very similar in purpose to the old-style flowchart, with the important difference that a flowchart is usually limited to sequential processes, while an activity diagram can handle parallel (concurrent) activities. An activity diagram is also similar to a "swim-lane chart", in which each "lane" is a separate set of functionality. Here is another example from the Distilled book:

This diagram shows the model of operations for a very simple ordering system. The main symbol of this type of drawing is the activity state or simply activity, shown as text inside a round-ended rectangle. The text contains either the name of the operation, or (if it is simple enough) a one-line description of the operation or activity. Another symbol, familiar to flowcharters, is the diamond that is used as a branch test where two or more different operations may be done based on some conditional behavior. In case of a branch, the way to get the branches back together is with the same symbol; when the separate paths of operation are re-combined, the diamond is called a merge, Finally, a fork indicates where processing splits into two different parallel threads of operation; this provides for concurrency. The fork symbol is a heavy black line, with one thread going into the top, and two or more threads coming out the bottom. Again, symbol re-use creates the corresponding join entity, which allows the concurrent threads to come back together. Note that, with rare exceptions, forks and joins must match up. Finally, the start and end points of the diagram are the same as in the state diagram above; a solid circle for start, and a "target" to end.
One of the main high points of the activity diagram is to show "stove-piped" operations. These occur when processing is performed in a sequential manner unnecessarily, as if it were taking place like smoke going out the chimney of a wood-burning stove. If a sequence of operations can be split into some sort of concurrency, an activity diagram will show it, and can also show where in the processing the split may make logical sense.
One reason that the activity diagram is sometimes referred to as a "swim lane" chart is that the diagram lends itself easily to division of operations among different parts of the system. Once the initial activity diagram is completed, the operations of each thread in the diagram can be grouped into similar system functions (or other grouping), and the sequential operation of each function block can be shown by drawing parallel lines down the page with the function label at the top. This provides a view which is much like a top-down view of a swimming pool, with lanes for each function block to "swim" in; hence the name. An example is in the Distilled book on page 136.
These two types of UML diagrams are known as "physical" diagrams, since they facilitate the modeling of physical parts or properties of the system. A deployment diagram shows the physical relationships among hardware and software components in the delivered system. A component diagram shows the components of the system and dependencies that relate them to each other. The main symbol in a deployment drawing is a node, which represents some type of computational unit. Frequently nodes represent hardware, such as a computer, server, or router. Lines that run between nodes are known in UML parlance as connections, and show the communication paths over which the system parts will interact. Nodes are represented as a box, in a "3D" style. In the component diagram, the main symbol is (duh!) called a component, and is similar to a package, except it represents the physical packaging of the code or executable. Components are represented with names in blocks, with the names underlined and preceded by a colon. Two small rectangles extend out of the left side of the block, making it look somewhat like an electrical plug. Examples of both types of diagram are combined in the figure below:
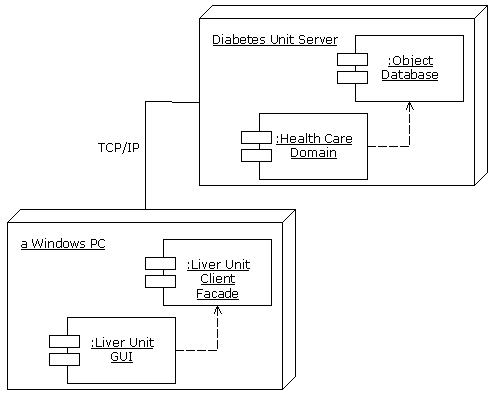
Although these two types of diagrams are useful individually, they are frequently combined to show which system components are parts of which nodes, as shown. Dependencies and connections are as shown. A new symbol we haven't mentioned yet, an interface is represented by a small open circle which is connected to the component by a single solid line.
Physical diagrams like these are useful when you need to show information that is different from the associated logical information.
There is an entire chapter (11) on this in the Distilled 2nd book, which does a very good job of demonstrating how to apply UML during the design process of a programming project, so I don't need to do another take on that here. Unfortunately, in the 3rd edition, Mr. Fowler has reorganized things. The "3" book has incorporated much of the information from the old Chapter 11 into Chapter 2 of the new edition, covering basics of several different software development processes. It you have the "2" book, read chapter 11 for all the details of how things translate between UML and design/code, but in a nutshell it simply goes through the entire process from system description to code. The steps are to make a class diagram, an object diagram (which we didn't cover but which is basically a special type of class diagram), and a specification diagram (same parenthetical applies). From this, a sample sequence diagram is shown, and then the code examples begin. All examples are well-documented. If you have the "3" book, read chapter 2. Not all the information from the second edition is there, but enough of it is to get the general flavor.
To his credit, Mr. Fowler is not writing a software engineering tome; there is a plethora of those already out there. However, his information in either book provides a good overview of how to apply UML in the course of a software development project, and is SO worth the read!
Time again to take a stab at doing this yourself. Try to model a system or systems that you are already familiar with. Make a state diagram of something like an alarm clock or the control for an elevator. Take an old project from one of your past classes and draw a package diagram and an activity diagram for it. Finally, make a Deployment diagram of one of your other programs for practice.