CMSI 543 / SYEG 557: Welcome to Week 12
This Week's Class Agenda
What's Going On This Week
- Kanban and the Kanban board
- Work In Progress [WIP] limit
- Tracking
- Burn charts
- Information radiators
- Feature Driven Development [FDD] "parking lots"
- Meetings or ceremonies
- Sprint reviews
- Retrospectives and post-mortems
Kanban and the Kanban Board
Kanban
OK, now it's time to focus on figuring out how we are going to track our progress and report it up the
chain to the powers that be
[as we say in the trade]. Tracking progress and measuring success is
pretty critical to any project, and Agile software development is no different. We need to be efficient
in the way we track progress, in the way we identify and report successes, and in the way that we can
uncover problems or areas that need attention or improvement [and yes, report those as well].
Kanban Board
Here is where we can really start to look at Kanban as a methodology, since it operates on a philosophy
of continuous flow
. This fact means that tasks are continuously added to the product backlog,
and are removed when they are completed. Since the focus is on continuous flow, there is no idea of
time-boxed
tasks, as there is with Scrum.
Kanban has three main characteristics:
- Visualize the Workflow
- Kanb an board maps the steps of the workflow in columns
- Tasks are represented on cards or sticky notes and are moved from column to column as they move through the workflow
- Limit Work in Progress [WIP]
- Assign limits to each column or workflow step, so that no one person/group can be overloaded with work
- WIP limits help naturally show up bottlenecks so they can be addressed and mitigated
- Measure the Lead Time
By understanding the workflow and indentifying/mitigating slowdown points in the process, teams will be able to discover the overall time required for each task. This information can provide metrics forlead time
tracking.
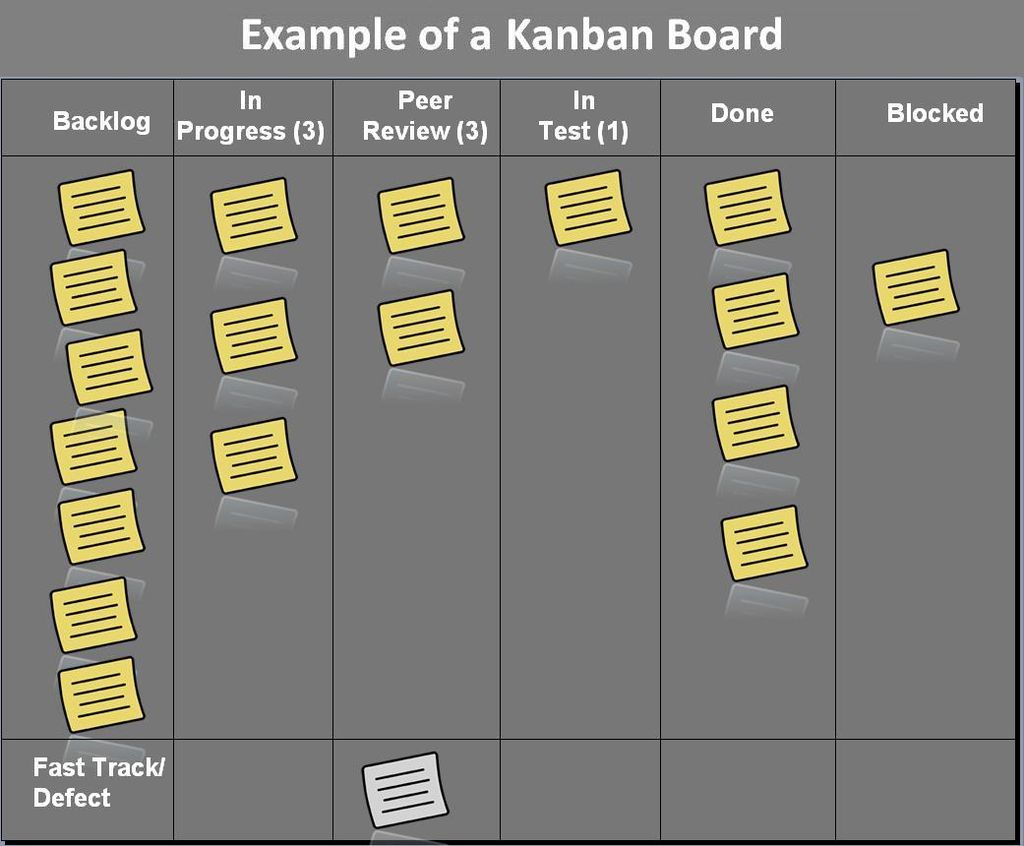
While Scrum is great for products that have a time-boxed workflow that can move in a series of sprints or discrete sections, Kanban is better for projects in which the workflow may not be predictable like Scrum, and for which unplanned work and rapid deployment of work products are the norm. For example, one possible application that would benefit from Kanban is a Help Desk, in which the normal operation is very short duration tasks that have unpredictable [un-schedule-able?] time durations. Many Kanban teams [and those using other methods] use whiteboards and sticky notes to create the project board used for tracking. However, anything that provides the appropriate format can be used, including a simple large sheet of paper. The columns on the board will change to meet the needs of the particular team that is using it. Typical columns on the Kanban board are as follows: |
|
|
|
Keep in mind that for any given team, the board may look different. There may be more or less columns, and they may have different names than these examples, but the intent will still be the same… to divide the project activities [the workflow] up into sections so that each task can be tracked and so the team will know what is going on at all times with each task, as well as what each person will be working on next. It's a constant flow, like a stream, which is why Kanban is good for manufacturing, and hence can be adapted for situations that have ongoing task structures.
Work In Progress [WIP] Limit
The Kanban method allows the team to have limits assigned to help the organization identify the points at which the process is slowing down, to help find the bottlenecks. Limiting the amount of work can be done at different values for different parts of the process, as we see here:
- Backlog: no limit to the number of stories
- Not Started: WIP limit of 5
- In Progress: WIP limit of 4
- Testing: WIP limit of 3
- Completed: no limit
The limits can help identify where the bottlenecks are. Let's see an example.
| Backlog | Not Started [5] | In Progress [4] | Testing [3] | Completed |
|---|---|---|---|---|
| Task M | Task H | Task D | Task A | |
| Task N | Task I | Task E | Task B | |
| Task O | Task J | Task F | Task C | |
| Task P | Task K | Task G | ||
| Task Q | Task L | |||
| Task R | ||||
| Task S |
[from Ashmore, p 215]
In the table above, it is easy to see that the developer working on Task D cannot pass that work along
to the testing segment of the workflow, since it is already full, having three tasks in it, which is the
WIP limit for that segment. She must wait, instead, until the Testing segment finishes one of its tasks
and pulls
the next task from the preceding segment. Likewise, she is not able
to pull
her next task from the previous segment, since she is unable to move
her current task to the next segment. As you can see, then, the whole picture of the current workflow
is presented, and things that are taking too long are easily identified by imposing the WIP limits onto
each segment of the workflow.

|
So, what to do?? In this case, it is pretty simple, as long as the developers are familiar with some of the other workflow segments. The developer who is stuck might be able to help the team in the Testing segment to finish some of their testing so that the segment has room to pull her work. That would leave her free to pull HER next task from the preceding segment. Of course, this example is somewhat idealized, since not all tasks require the same amount of work to complete them. Nevertheless, you can easily see how this process enforces the first principle of Kanban, namely, visualizing the workflow. Another reason WIP limits are good is to help with the second principle: limit WIP. Having set limits can help keep the PO or the executives from trying to force too much work on the team. Just as Scrum limits the amount of work by only allowing the team to commit to what can be done in a single sprint, Kanban does the same thing by limiting how much work can be in each queue [segment]. |
Finally, WIP limits can help with the third priciple, the ability to measure the lead time. The lead
time
is the time from the moment when the request was made by a client and placed on a board to when
all work on this item is completed and the request was delivered to the client. So it's the the total
time the client is waiting for an item to be delivered. The other pertinent metric, cycle time
,
is defined as the amount of time, that the team spent actually working on this item [without the time
that the task spent waiting on the board]. Therefore, the cycle time should start being measured when
the task task enters the In Progress column, and no earlier. Lead time provides the Kanban team with an
estimate of how long it will take a task to go through the entire process from beginning to end, much as
the velocity in Scrum tells the Scrum team how much work they can do in a particular time.
Tracking
Whatever method you are using for Agile development, and even if you are using Waterfall or some other method of project management, it is critical to be able to track progress.
Extreme Programming
In fact, Extreme Programming takes tracking SO seriously, that one of its roles is actually named
tracker
as we've seen. The tracker in XP talks to the developers every day,
asking two questions: 1) how many ideal days has she worked on a task; and 2)
how may ideal days are remaining on that task.
Notice several things about this exchange. First, it is face-to-face with every developer every single day of the project. The tracker thus has a daily idea of the two major metrics of the project. Second, the face-to-face nature of the interaction reinforces the concept of communication between all team members. Third, the time measurement is ideal days, which is the kind of time that many software developers are used to citing, so it puts the project time cycles for the developers in terms of something that is familiar and natural to their way of thinking. Finally, it gives the tracker [or some other designated person on the team] the responsibility of translating these ideal estimates into the real-world estimates that the project manager and customer require to ensure that the project is on track.
Burn Charts
Burn charts are a way to show progress on an iteration [sprint] or even a release, so that the team can decide if action is needed to change their approach so they can meet [honor] their time commitments. There are two flavors of burn charts: burn up charts and burn down charts. For both of these types, the X-axis along the bottom of the chart indicates time that passes, while the Y-axis indicates the amount of work that is to be [or has been] done.
Burn Up Charts
Burn UP charts usually depict progress toward a product's release:
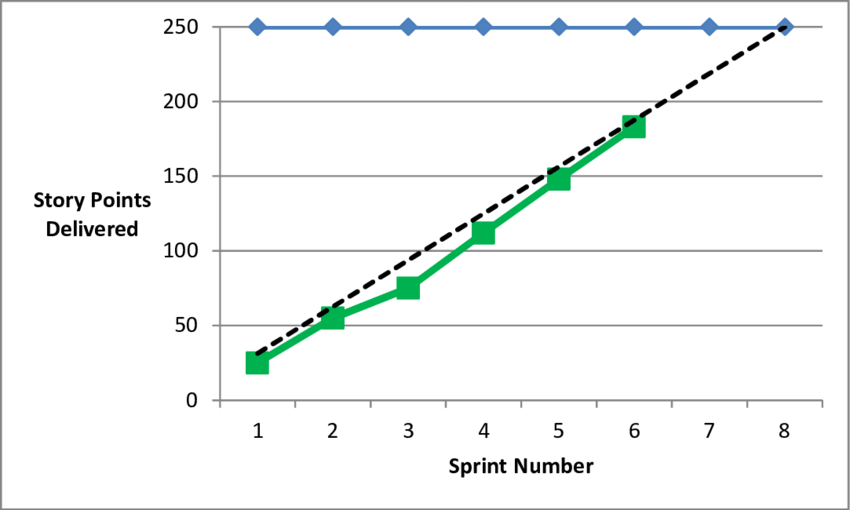
In the figure, it is easy to see that the number of story points increases by a certain amount for every sprint that completes. It is also easy to see the total number of story points that are required for the project, as well as the idealized that the development would like to proceed along as the sprints complete. Notice the dip in the green line away [below] from the ideal black dashed line on the figure. This indicates that for sprint three, something occurred which kept the team from meeting its goal. Apparently, however, there were steps taken to correct or overcome that situation, because slowly over the next three sprints the lines converge again.
QUICK QUIZ: what if the green line went ABOVE the black line? What would that show? Would that be good or bad?
There are a couple of things to note about this chart. First, the timeline across the bottom is measured in sprints; this means that the data has some latency ~ it is not immediate like a daily standup might be. Second, it is quite easy to see when a sprint team or a project is starting to fall behind. By the same token, it is also easy to see when a project is catching up again. Finally, the blue line across the top of the chart shows how many story points there are for the entire project. While this may seem to be superfluous, it provides the function of tracking the total stories. If the customer needs to change and add or take away stories, that will be reflected on this line on the chart as well.
The scale at the bottom can be flexible. It might be sprints, it might be months, it might even be done in fiscal quarters. Regardless of the scale, it shows the same TYPE of information. One thing it does NOT show, however, is if the team is delivering the RIGHT user stories. This can be done by labeling the points on the line with some milestones of the project, so that the stakeholders can see that the team is not only on track but is on track with the right stuff.
Burn Down Charts
Burn DOWN Charts serve a different need, that of tracking the project on a more
granular level. Burndown charts are the tracking used during daily stand-up meetings to track individual
sprint progress. They show that the team is where it is supposed to be at a specific point in time. It
can allow the team the time to course correct
as early as possible to avoid missing any critical
commitments.
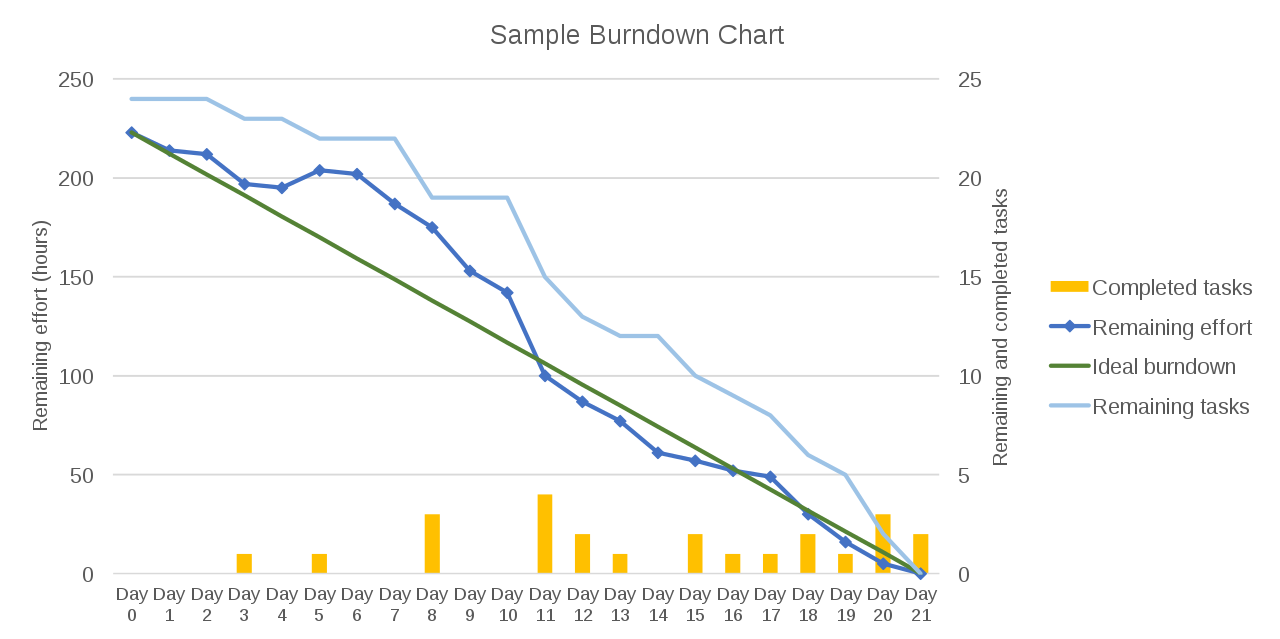
On this chart, it is easy to see the number of days as the time line, and thenumber of effort measured in hours, that this sprint will take. The straight green line is the burndown line, a linear graph showing the number of story points to start with and a linear slope to zero; the line goes to zero to show the remaining number of hours of work each day. The dark blue line shows the remaining effort for the sprint, and should track close to the green line. The light blue line shows the tasks remaining to be completed. This particular chart is augmented with the bars at the bottom which show the number of completed tasks.
Several things are apparent from this chart. First of all, it shows that the team got off to a bit of a rocky start; the dark blue line is above the ideal, meaning that it took longer to get the first few tasks done. The blue line shows that the hours of effort didn't decrease over the course of day 2 and day 4, at least not by much. In fact, on day 5 the remaining hours actually went UP meaning progress went backwards, and then on day 6 did not significantly improve. However, from that point on, things got better, until on day 11 the lines cross and the effort tracks the ideal for the remainder of the sprint.
Another thing to note about this chart is that the number of remaining tasks in the light blue line and the number of completed tasks in the yellow bars also show the project in trouble at first and then finally smoothing out. On days 8, 11, and 12 there were significant numbers of tasks completed [looks to be about 9 tasks total] so the light blue line takes a BIG dip downward on those days. Eventually the lines all converge on the last day, so the team was successful in meeting its goals.

|
One final thought: does anyone notice the duration of the sprint? It is not in line with the number of days that are recommended for sprints. The days should be multiples of five, since there are five days in each work week. Having a sprint of 21 days seems off. There are any number of reasons why the sprint might go |
Information RadiatorsAn information radiator is simply anything that is posted in a common and highly visible location so the team members can see it anytime they walk by. They are similar to the ads we all try to ignore on our search results but end up reading anyhow ~ just simple frequent reminders of things that we need to keep in our minds as we go about our daily tasks. For example, the graphic in your textbook on pate 221 shows the burndown plan next to a list of the five items in the working agreement. Or, it might include some best practice statement or a common status. Information radiators [named radiators like the heater] are intended to impart a sense of urgency to the items they contain, to keep them fresh in the team's minds. They are also intended to promote a sense of positiveness, and might contain birthday wishes or other congratulatory messages. |
|
Feature Driven Development [FDD] "Parking Lots"
In FDD, there is an excellent way to track work on larger projects. In this case the focus is on keeping
track of a larger body of activities which are part of a cohesive product. The parking lot
is
similar to the Kanban board or Scrum board, in that it shows the current status of the project, as well
as the current status of each of the tasks or user stories, or features
to use
the FDD term [Feature
-Driven Development, remember…].
|
An example of one entry in the FDD parking lot is shown at the left.
The entry is for the named feature which consists of seven stories
that total 32 points. At the moment, the feature is 75% complete
and is due in August of 2020. However, the line indicating the
color of the feature is Take a look, though, at the tables on page 223 of your textbook to
see a much broader view. You can see how this one little feature
plays into the overall scheme of the development. This is why the
|
||||||
| [From Ashmore, p. 222] |
Other Tracking Methods
There are other charts that can be used to track progress. The Gantt chart is a more
linear model of the project, as we've seen, which has its beginnings in the Waterfall method. However it
still has usefulness in Agile, since it can be used to track sprints just as well as waterfall tasks.
Another method is the stoplight chart which is much like a Gantt chart but with coloring
to show what tasks are ahead or on time [green], which ones are in jeopardy [yellow], and which ones are
in dire straits [red]. The colors are the reason it's called a stoplight chart. There is a tendency
to add colors to show increased granularity. Notably, blue is often used for something that is really,
really green
. One other tracking chart is known as the PERT chart, which is an
acronym for Program Evaluation and Review Technique
. A PERT chart is intended for very large-scale,
one-time, non-routine, complex projects with a high degree of inter-task dependency, projects which require
a series of activities, some of which must be performed sequentially and others that can be performed in
parallel with other activities.
Tracking Quality
The Agile philosophy is built on the idea of writing high quality code at all times through use of pair programming and test-driven development. However, poor quality can still seep into the project; we're only human, after all!
Build Status
Once test has been completed by the developer using her own code, the first check for product quality [or the second by actual count] is to check for errors when the code is integrated. The different types of testing were covered last week, so you should be familiar with them already. The integration tests can be done manually, but when a large number of components are to be tested together, automated testing is a much better idea. This method allows the teams to discover defects very quickly, since a previously working build that is broken by one commit only has one set of code to examine. This situation is also improved by the fact that nightly or daily builds keep the amound of additional code very small.
Defects
Defects are normal. Wait, let me say that again: defects are normal! It is impossible to produce code that is defect-free. Ultimately, you want as few defects in the product as possible, and it is critical [as discussed over and over] that proper and extensive testing be done, but you cannot ever guarantee 100% that all defects are removed from the product, especially if it is a complex one that involves distributed computation.
Defect counts can also be tracked as a metric. Next week we'll see one way that defects can be tracked, as part of the Software Engineering Institute's [SEI's] Personal Software Process [PSP] method. There is a plethora of methods for tracking all kinds of quality issues, and this could certainly turn into a long seminar session, if not an entire class, if we tried to go into the details of them all. It is enough to say that if the team is tracking defects, and that data is not trending DOWN over time, then the team knows that either closing the defects is not given high enough priority or that the new code continues to have more and more problems, not less and less. Either way, it is critical to focus on the situation immediately!!
Test Cases
It's important that tests cover both the functions of the product and the usability of the product. In the Waterfall method, there was frequently a test team or even a test department that was tasked with performing the testing of the product. This activity involved several things including looking carefully at the requirements, reviewing the design, inspecting the code, writing an overall test plan document, writing and implementing a test procedure document, executing the tests, and evaulating/presenting the results. Obviously these activities consume significant time and resources, and it is not unusual to see the testing phase of a project get short shrift, or even become an afterthought.
With Agile and TDD, testing is considered an integral part of the process, so this situation is less likely to occur. The development team is tasked with writing tests for their code as the development proceeds, so when they are finished there is a suite of tests that can be run to verify the code.
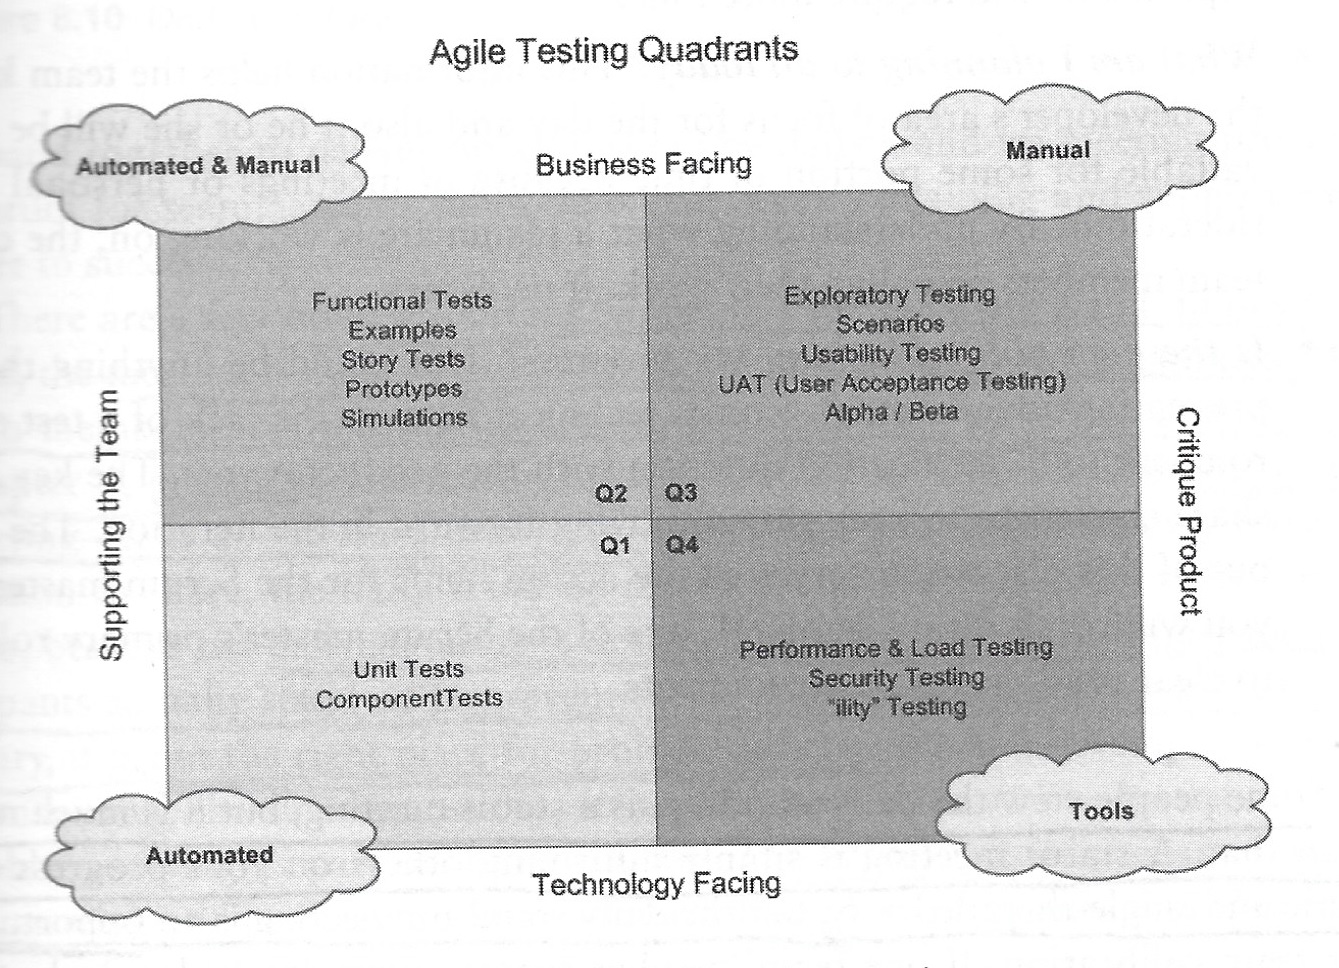
The diagram above shows the several different categories of testing, which are one way to look at the testing process for Agile development. Start with Quadrant 1 [Q1 in the diagram] in which the developer writes her own tests at the unit level, meaning for each method produced. These may be combined later to produce component tests at the next-higher level from units.
As you work your way clockwise around the quadrants, you get to successively higher levels of testing. You can see in the labels how the testing can be built on the test products of the previous quadrants, and you can also see from the labels in the clouds on the corners how much automation can be expected to be part of the testing process.
One more point to note is the labeling on the outside edges of the diagram, which indicate the focus of each PAIR of quadrants that the label spans. For example, Q1 and Q2 are primarily for supporting the team, while Q2 and Q3 are more in support of the organization's business. There is intentional overlap between these, since it is an iterative process.
Meetings or Ceremonies
In the Agile world, the Scrum, Lean, and DSDM methods all recommend a daily meeting, often called the
daily stand-up
and frequently referred to as the daily scrum or even just by
the shortened scrum. This is a very important part of the Agile process, as we will
see.
Daily Stand-Up Meeting
There is much more to the daily scrum than just reporting status. We have participated in our own scrum meetings in class [or we will soon], so we all know the topics that are part of the report. Here are more in-depth explanations:
- What did I do yesterday: provides the opportunity to say
these tasks are closed [completed] so I can move on
, orthese tasks are still in work
, or sometimes eventhis task is harder than I expected and will take another day
. It also lets the other team members know where that developer is, so that they may assess their own needs, in cases for which they may be relying on the work of others being completed. - What am I planning to do today: helps the team know what the developer
is planning to focus on that day. In the case for which the previous task is completed, this is an
opportunity window in case there needs to be re-prioritizing of tasks for some reason. It also is
a chance for the team to see availability, in case someone has a meeting or other commitment that
requires attention; the
planning to do today
doesn't HAVE to be a project activity. - Is there anything blocking my progress: this might be ANYTHING that is blocking the progress of the developer. There could be a technical issue; there might be something the developer needs from another team member; or there could be a question that she needs answered in order to complete a task or for clarification. The key idea is to share any challenges that the developer is experiencing so that they can be addressed to keep things moving forward.
The scrum is more than just a report; it is an opportunity for team calibration to make sure on a daily basis that the team continues to make progress. There are several other important considerations to this calibration.
The first consideration is, who gets to talk. There is frequently reference to Nevertheless, it is important in the scrum meeting for only the team and the SM to be talking. Others may attend, but they are rarely, if ever, allowed to say anything. The second consideration is that the meeting is conducted standing up to help keep it
short. If people are allowed to sit down, meetings end up taking longer. Think about any
meeting you have had in the hallway with a coworker. It probably didn't last more than a minute
or two, because you are both in the middle of something. That is the idea here; the development
team members are ALL |
|
A third consideration concerns who runs the meeting. This, of course, should be the SM. This means that
if a discussion develops between two or more team members, it is the SM's responsibility to facilitate
taking it off-line
, meaning postponing that discussion until AFTER the scrum meeting is over. A
scrum meeting is not the right place for solving problems, only for
reporting them.
Sprint Review or Demo
This meeting is an opportunity for the team to show its work, demonstrating the current version of the working software to a wide audience of stakeholders. However, it is NOT intended to be a large meeting with a powerpoint, lots and lots of people, catering, hotel accommodations, and the like. It should be a demonstration meeting that takes two hours or less to complete, during which the team, led by the PO or the SM, will describe the user stories that have been implemented [at a high level] and the SM or designate will demonstrate the working software.
XP teams often have the customer lead the demonstration, because the team wants to know how the software will work when it is being used by the person that will use it in real life. This allows the customer to see how things work, to get familiar with the operation, and to provide feedback while the software is being used.
If the feedback is negative, the team has the chance to evaluate whether they will publicly release the version of software or not. If the feedback is positive, the new software or features are validated and can be treated as ready for deployment. The PO is responsible for collecting all feedback and figuring out which items will be addressed in future sprints, as well as what priority ordering should be given to those issues.
Retrospectives and Post-Mortems
|
Retrospectives are a forum for the team to have an open communication about the project as it is wrapping up its completion of a sprint. It provides a vehicle for continuous improvement of the process so that the team can get better over time. The real value of the retrospective comes in the sense of teamwork and trust that is emphasized during this meeting. Talking about how the team is getting along can be awkward at first, but once the team has moved past any discomfort, it is the surest way to improve things. Team members can make comments about what they feel the team should start doing, what they should stop doing, or what they should continue to do for the next sprint. The table on the bottom of page 229 in your textbook gives examples. One way to do the retrospective is to have each team member write their suggestions on sticky notes and post them on a whiteboard. Pay no attention to prioritizing at this point, simply post the ideas. Then give each team member three small stickers [gold stars, smiley faces, whatever] that can be used by the person to indicate the items they feel are most important. When the exercise is completed, the sticky notes with the most stars/smiley's/whatevers are shown to be what the team feels are the highest priority items. |
Measuring Success in Agile
How do you know if you are successful? Is it simply a matter of the customer feeling you have delivered
a product that provides them with business value
? Is it an evaluation of metrics, like those used
in the Waterfall method? Or perhaps is it something entirely different?
One way to look at success suggests four categories of measurement:
- Do it fast: we can measure the team's productivity using velocity
- Do it right: we can measure the team's quality in the number of defects
- Do it on time: we can show a predictable ability to meet commitments
- Keep doing it: we want to measure
employee satisfaction
which is a critical part of sustainability in the Agile principles
One of the managers I worked for at Boeing came up with a phrase that sort of encapsulated these four ideals:
Make it right, first time, on time, all the time!
Class Time for Project Groups
I can assign breakout groups or if you like you can have your own zoom meetings.