CMSI 543 / SYEG 557: Welcome to Week 09
This Week's Class Agenda
- Announcements
- Grooming the product backlog
- Prioritization of stories
- Estimating
- Scrum grooming
- Scrum sprint planning
- XP Planning
- Maintenance of legacy code
- Triple constraints
- What about Kanban?
Grooming the Product Backlog
We all know how important good grooming is, it's something that our mothers taught us growing up, right? It is no different with Agile. We need to keep things orderly and organized, and this is what is referred to in Agile as
good grooming
. As development progresses on the project, the requirements [which we now calluser stories
] must be turned into functional descriptions which the team can use for actually making the software. This activity includes several different actions that are important to the process, including:- Prioritizing the user stories
- Estimating the size of the stories
- Maintaining the project tracking

As we've seen, the full list of the desired features for a software product is captured in the collection of user stories that are known as the
product backlog
. Remember that the stories which are further down in the backlog which will not be worked on for at least a couple of sprints will most likely beepics
which will need to be broken apart intochild stories
. This is just fine, as we've discussed. We say that stories which are further down aredeeper
in the product backlog. The stories that are higher up, near the top of the backlog, will have been given higher priority by the PO and the customer.
In fact, because of several considerations with respect to the backlog, we can apply the acronym
DEEP
which breaks down as follows:- Detailed appropriately, meaning that the stories with the highest priorities are broken down far enough to provide effective input to the development team, so that they can use them to design and code [and yes, test]; any questions that have arisen in the process of breaking these stories down need to have been answered so the stories contain all the pertinent information.
- Estimated, so that the team understands completely what the stories are; the team also needs to believe that there is sufficient information in them to be able to correctly estimate the amount of effort [read story points] that is needed.
- Emergent, which is poking at the fact that the backlog is CONSTANTLY EVOLVING; it is not a static thing and must be revisited many times as new information is uncovered and/or discovered.
- Prioritized, which means EXACTLY what it sounds like; all the stories have a priority associated.
Things are slightly different with FDD, since it breaks down the team roles differently and has the idea of
classes
that must be integrated to deliver the desired functionality of the project. Instead of the Scrum user story hierarchy, FDD uses a three-level hierarchy:- The problem domain or other subject area, which is the major category of a specific part of the project
- The business activities which are a breakdown of the problem domain into smaller portions that have greater granularity within the classes
- The individual features are the lowest level which break the business activities into the smallest part that the developers can work on
Remember that different companies keep their product backlogs in different ways, but regardless of where the backlog is housed, it still needs to be prioritized and estimated, and the backlog must be iteratively maintained.
Prioritization of Stories
Following are several methods or tools that can be used for prioritizing:
Based on Value
What is
value
? We've discussed this in class previously, but there is more to the idea of value than just the financial aspects. For example, there can be positive value derived from providing some operation that users like and will not only pay for but will share with other potential users so thatword of mouth
advertising helps build both the business and the organization's reputation. There can also be negative value if, for example, the software doesn't have a competitive feature set or is too expensive. Sometimes value is derived from pursuing new market opportunities. At other times, value may be derived from reacting to features provided by the competition.Value must be supported by a
Return on Investment [roi]
as well. It does not work well for a company to spend more than it can take in, so this is an important metric to track and to consider. If the cost of delivering a feature is so high that the overall price of the product is not competitive, it won't sell well, and the ROI will suffer as a result [low ROI]. In this case, the feature should most likely bedeprioritized
. Another consideration is the risk associated with the feature; for example if the stability or robustness of the application might be in jeopardy, again it might be better to deprioritize the feature.Value Stream Mapping
This is another concept that comes from LEAN. Value stream mapping is designed to remove waste from the development cycle by starting and stopping the activity with customer activity and communication. The whole process [or cycle] is viewed from the customer's perspective, which allows the team to identify bottlenecks or
breakpoints
at which the customer experience is not optimal.One reason this can happen is because of organizational processes or silos which may have developed without regard for how they may affect the customer. The process of doing value stream mapping is to flow all of the transactions of the project from the viewpoint of the consumers to ensure that thier user experience is optimized. Mapping from this perspective can help with prioritization, since it lets the development organization ensure that it is satisfying a meaningful customer need in a way that adds value, both to the customer and to the solution provider.
MoSCoW
Another way to prioritize is one we've seen before, called
MoSCoW
. The letters in uppercase stand for the categorizations that the priorities would be mapped to in this case:
- Must have: this is a user story that there
is no doubt must be included in the sprint; this is similar to the Waterfall's
shall
statement. - Should have: this is a user story that is important to the funcitonality of the application, but might be omitted if circumstances such as time or resource constraints appear which make paring down the story count necessary.
- Could have: this is a user story that enhances the system and provides functionality but is not critical to delivering the application on time
- Want to have: this is a user story that will
NOT BE included; such features only serve or appeal to a small group of users and do not
have the same importance as other stories, because they do not drive enough business
value into the product. These stories are sometimes called
stretch goals
since they are only included if the development time has the condition of finishing early so that the schedule is able tostretch out
by including them.
Note that some people use
Won't have
in some cases, because the last items can be left out entirely, and thus are eliminated from the prioritized backlog.Kano Model
The Kano model was introduced to help organizations learn how to build products that
delight
customers. The model is helpful to prioritization because it breaks features down into three categories, similar to the way MoSCoW divides them into four:- Basic needs: these are user stories that MUST BE
THERE for the product to be considered
working
by the customer. The functionality is expected, and if it is missing the user will be GREATLY dissatisfied. - Performance needs: these are user stories that add necessary functionality to enhance the user experience with the product.
- Delight or Excite: these are user stories that will make the users sit up and take notice; they are an unexpected bonus from the users' standpoint.
The challenge when prioritizing is that the team needs to focus on enough of the basic needs and the performance needs to make a solid working product, and also needs to give enough weight to the delight needs to make the product different or compelling in the marketplace.
Over time, the Kano model adapts the items in the three categories, in a dynamic way, so that after some time passes, the lower categories move up. Delighters become performance needs, and performance needs become basic, so that over time as the competition evolves and the products mature, the delighters will become basic needs to keep pace.
Estimating
Another activity the team must be involved with is making estimates of how long the development effort will take to complete. This has several ramifications for the project. As we have all heard,
TIME IS MONEY
, which is born out by the fact that everyone is PAID for their time, and hence the time COSTS. Obviously, then, the customer wants to know how much they will be paying for the product, and that directly correlates to the time it will take to produce it.In order to have some sort of idea of the duration and cost, it is necessary to make estimates. It is impossible to know EXACTLY how much effort the project will require, especially at the start-up phase of the project. However, by the time we are
grooming
the backlog, we have already developed some idea of what is involved, so all that remains is to assign some values to the user stories we have, so that we can see [and show the customer] what is required to meet our plan.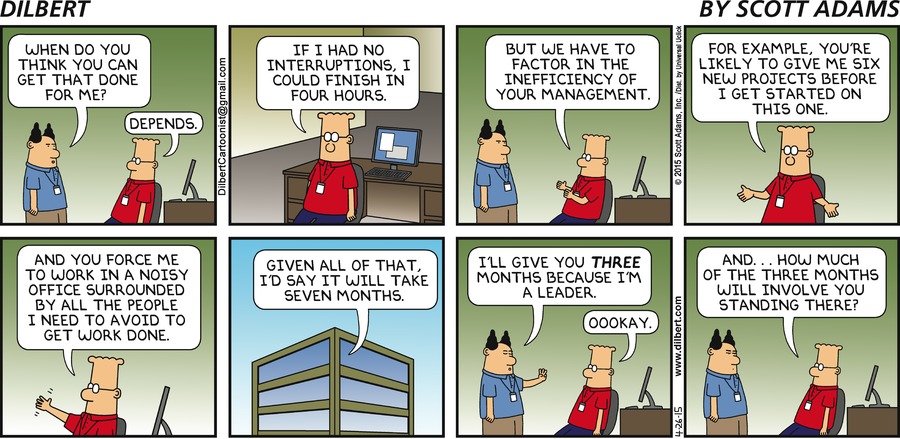
Level of Effort [LOE]
One way to obtain an estimate is using a very easy method that evaluates the user stories in terms of a ball-park sizing into three categories of small, medium, and large. This is known sometimes as
T-shirt sizing
, for obvious reasons, although there is not a sizeExtra-large
per se. The team can add that size, along withpetit
or any other sizing they decide is necessary to more accurately reflect the estimates.One thing to note about this method of sizing: it might be difficult for the team to come to a measure that is easily quantified. For example, how does the team know what is a
large
as contrasted with anextra-large
user story? And then, what differentiates between anextra-large
user story and an epic? It may be hard to say, for example, that the team can handle three smalls or two smalls and one medium or two larges at once. For this reason, it is usual to have this kind of estimation measure only when it is early in the process, so that the estimates can be refined later in the project.Here is a site that has several other methods of sizing as well. It's where the picture comes from, too.
Ideal Time [Days or Hours]
For this method, the developer figures out what amount of time the task would take under ideal conditions. In other words,
ideal
means with no interruptions, no meetings, no phone calls, no sick time or vacations, NOTHING that would interrupt the process. Of course, this is completely not real; it is an ideal case. However, it does provide a baseline for comparison. Even though it is unrealistic, the organization might use that baseline and apply some factor to convert that ideal time into a measure ofclock time
. A factor of 2-to-1 is typical. The advantage of using ideal time is that it is relatively easy for the developers to estimate, as long as the user stories are reasonably well-defined, thorough, and discrete. However, since it doesn't account for any interruptions, it also may not account for the fact that developers tend to UNDERESTIMATE the time it will take them to create the product, even with ideal time. You can see, then, why estimating is difficult!Hours
Hours
is simply the number of hours that the development team estimates that the project will require. This is a fairly accurate way to estimate because it is discrete — there is only one definition of anhour
as a quantity of time. The disadvantage of using this measurement at early stages of a project is that the team may not have the required information they need to make an estimate based on such an accurate and precise metric.Story Points
The idea of
story points
is that it is an arbitrary measurement that allows the team to get an idea of the size of effort required for a task without having to bind that expectation to some precise estimation of hours spent. One way to do this is to use the Fibonacci Sequence to provide a relative size of the user stories.Fibonacci Sequence
The Fibonacci Sequence is a mathematical tool devised in the thirteenth century for use in making rational approximations. You have all seen this, no doubt, as the sequence:
0, 1, 1, 2, 3, 5, 8, 13, 21, 34, 55, 89, 144, 233, 377, 610, 987, …
… where each number in the sequence is the sum of the previous two numbers in the sequence. The sequence turns out to be a handy method of assigning story points, because it gives the team an idea of relative size without having to
nail down
specific values. For Agile, the sequence has been changed slightly so that there is no zero or one. The values usually start at two and progress up to twenty-one, then skip to 100. Some teams keep the one value; some even add a one-half value to indicate a user story that is so trivial it is barely worth estimating, but will require some amount of time to produce. Some teams may modify the values to change 21 to 20, then add a 40 as well. The only difference between 20, 40, and 100 is just to get a sense of size of an epic; it would not be practical to try to handle a user story that is 20 story points, since that would be nearly an epic and should then be broken into children.
Another consideration might be to use a zero, 1/2, or one for a user story that needs to be tracked but is actually being developed by another team. In this case it acts as a placeholder, and might even be used to reflect the fact that there should be some minimal effort attached to integrating the parts or perhaps minimal testing of interfaces. Additionally, some teams have begun to use the
infinity
symbol, not to represent a story that will take forever, but as an indication that there is not enough information known about that user story to break it down appropriately.Story points are an abstract measure and as such are negotiable by the team. One story may get a value of 2 story points from one team and 5 from another. This doesn't mean one team is wrong; it is merely a reflection of the relative size the team assigns to the story. One good way to get started is for the team to identify a common task for which everyone knows an approximate level of effort that is required. Making a baseline estimation based on that commonly understood task gives the team a relative value for estimating the rest of the stories in the project.
Team Participation
For estimation tasks, the team must all participate, so that everyone can benefit from the wisdom of the self-organizing team philosophy. The team approach has several advantages over having a single person be the one to size a feature or story. One way to do this as a team is to make it into a game.
Planning Poker
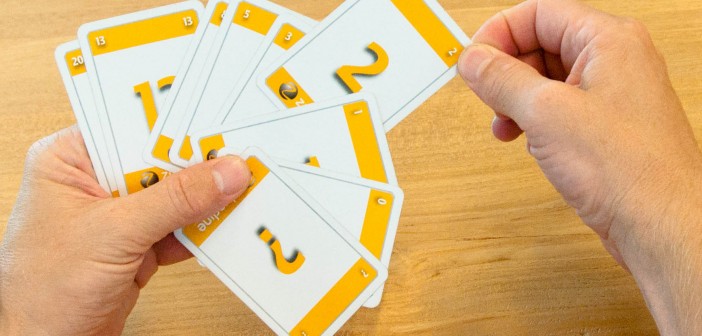
Planning poker is a way to get everyone's input on what they feel is the appropriate size for a particular user story. The game is moderated by the Scrum master, and the development team all plays. The process is for the Scrum master to put down a user story, and each of the team puts out a card with their that has their estimate for that story. Some teams have everyone
throw
at once, so that no one can be influenced by anyone else's estimate. If there are minor discrepancies in the numbers, the team usually can talk that out and decide on a number. However, if there are significant differences in the values, the team must have a more in-depth discussion to decide the appropriate value for the story.It is important to realize that these discrepancies do NOT mean that one person is right or wrong about the estimate. It merely reflects that there is a lack of common understanding about that particular user story, such that the team needs to discuss it, and perhaps may need to get more information from the customer or PO to complete the estimate. The discussion should take the thrust of an exploration into what is not known.
Wide-Band Delphi
The Delphi method is similar to planning poker, but takes a more structured and formal approach. To start with, there is a
facilitator
who calls the meeting of the experts, and specific feature is discussed among them. Each expert then completes a form that provides her estimation; forms are submitted anonymously and are returned to the facilitator. The facilitator then compiles the results and returns the forms to the expert team, who discusses the feature again. The process iterates until all the experts agree on a value for the feature. Note that for Delphi, a feature is similar to a user story [but not necessarily the same], and the estimation is iterative.The big drawback to this approach is two-fold: one, it is time-consuming because of the iterative way it is done; and two, the experts are not required to talk about why they pick the specific times they have chosen, so there is little in the way of explanation for their rationale. A third possible drawback is that the team has to fill out forms rather than simply saying their estimates out loud, which costs even more time.
Crystal Family
Crystal uses three distince phases for estimation:
- Proposal stage: the developers review the initial requirements and work breakdown to provide an estimate of the work that is needed
- Exploration stage: many more details are gathered and as a result the estimates can be refined so that they are closer to reality
- Planning meeting: each element is broken down into a discrete task and is assigned to a specific developer for implementation
XP
With XP, it is a critical point that ONLY the developers make the estimates. They are also the only ones who can change the estimates, too. XP provides a feedback loop for the actual time required, so that the developers can continue to improve their estimates over time. This helps to improve the accuracy of their estimates for successive projects, in the same way as the Waterfall process known as PSP can improve accuracy over time for Waterfall developers.
Lean
In the Lean method, the estimation process is delayed until the feature is nearly at the top of the list of things to be worked on. Since the focus is on eliminating waste, the Lean method keeps estimation [and several other activities associated with any feature] until the last possible time, under the rationale that the feature may end up not being needed or developed, so it would be wasteful to do the estimation for it unless it is guaranteed to be part of the project. Further, if estimation is done too soon, the team rists creating inaccurate expectations that also increase the amount of waste in the project.
Scrum Product Backlog Grooming
The activities that have just been described often take place during a special session which is called
product backlog grooming
. This is a meeting between the Product Owner and the Scrum master primarily, although the entire team may be included. The PO leads is responsible for leading the meeting, which is used to clarify and improve the user stories, and which may include the activities of breaking down epics, improving stories which are poorly written, and adding acceptance criteria.The goal of this grooming session is to end up with good, solid user stories which are prioritized, discussed, negotiated, well-clarified, and that the entire team agrees upon.
Team Velocity

As teams work together over time, they start to get a sense of how fast or slow they work. The term that is used for this
fastness or slowness
isVELOCITY
, and it's defined as the amount of work that the team can usually deliver within the time frame of a sprint or iteration. This value can be used to predict the amount of time the team will require for similar tasks in future iterations. The most common measure for velocity is, of course, our venerable story points.The first few iterations may have no velocity, since the team really may not know what their velocity figure is. In this case it can be more guesswork than precision, which is actually fine, since it provides the opportunity to inspect and adapt, and to communication among the team members about it. One usual rule of thumb when starting out is to use a value of 0.7 for the team's velocity. This is a pretty fair guess most of the time, and means that the team's working time will be about 70% of the team's available time. In other words, for every 10 days of work time, about three of those days will be taken up with holidays, software installs, paperwork, phone calls, meetings, sick time, and other non-development tasks. This is actually a conservative estimate, which means we are starting out by OVER-estimating that non-productive time, but that's OK to start with. It provides the team with a starting metric they can use for estimation and is likely to increase over time as the team gets more experience with each passing iteration. This is an advantage, since with short sprints the team will be able to adjust its velocity often.
Velocity is calculated based on the number of days of work it will take you to develop a user story, or perhaps an iteration can be used. In some cases you can use the entire project, but that sort of defeats the purpose. If you divide the days of work by the velocity you get the actual days required to get the work done.
For example, if you use a 4 week sprint, that is 20 days of time. If you use the starting value of 0.7 and multiply that by the velocity, you will see about 15 days of actual productive time.
Looking at it another way, take the number of days the team actually worked on a sprint, divide it by the velocity, and you will get the amount of time that you should use for your estimate. Note that you can use story points, hours, days, whatever metric you want, and the velocity stays the same since it has no units associated. It's just a ratio, but nevertheless a powerful one!
There are, of course, some potential drawbacks to velocity. If the team members are not dedicated to the team full-time, it can be hard to predict their availability. Velocity can be disrupted if the team is forced to vary the length of the sprints during a single project. Another consideration might be extended time off for more than one member of the team at the same time. There may be external factors as well, such as if computers break or the network is interrupted, or if the executive team and/or other stakeholders are not fully committed to the
sacredness
of the sprint and keep introducing/demanding new changes to the product, user stories, priorities, or backlog.As we've already seen, velocity should MOST DEFINITELY NOT be used as a management metric, particularly if it is based on story points, which are an arbitrary measure that is defined by each team. Management must be careful to AVOID using velocity as a performance indicator, since 1) it is arbitrary and hence can be inaccurate; and 2) it can lead to unhealthy team behaviors.
Extreme Programming also uses the concept of velocity for planning, but allows for two different types. In one way, you can set a date and determine how many stories can be implemented by that date. In the other way, you can define the specific scope of the sprint and determine how long it will take to finish a defined set of stories.
QUICK DISCUSSION QUIZ: which way makes more sense to you — setting a date first, or defining the scope first?
QUICK DISCUSSION QUIZ: what kind of
unhealthy team behaviors
can you think of that might happen if velocity is used as an indication of performance?LEAN has velocity, too, but it encompasses some of the manufacturing ideology, so the developers are working with a pull
scheduling system, meaning they pull the right amount of work that can be completed within the time frame that is allowed to them. Once the team establishes their velocity they will only pull the amount of work they can reasonably complete.Definition of
Done
How do we know when we are DONE?? This is a concept which requires the team to have a meaningful conversation with the PO, the SM, and the other stakeholders to ensure a common understanding of what the
definition of done
really means. Does your team include code reviews as part of the definition? Does the PO think that the team is going to update the release notes before a sprint is considered complete?Every new team should dedicate time to discussing and agreeing on the definition of done, which may or may not include elements such as code that is checked in and integrated and has automated tests. [Cohn 2010, p. 259; in Ashmore, p. 163]

Incorporation of
Technical Debt
Another discussion that the team must have is how to handle technical debt.
Technical Debt
has many definitions; there are whole books written on this topic. One commonly used definition is:Technical Debt includes those internal things that you choose not to do now, but which will impede future development if left undone. This includes deferred refactoring. [Cunningham 2012, in Ashmore, p. 164]
There are two basic kinds of technical debt: unintended and intentional. The former is simply the consequence of the teams learning curve. It might be due to a poor initial design or lack of adequate testing. Intentional technical debt is the kind that is incurred as trade-offs are made in the course of the development activity. It may be decided to incur short-term or long-term tecnical debt for a strategic reason. Either way, when the team is ready to address the technical debt, it should be included in the backlog of prioritized stories, although there is some debate on this topic.
Bugs
Bugs are different than technical debt, as you might expect. They are a type of defect but are not the only type of defect as you may surmise from your textbook. For example, a defect might be a missed semicolon in the code that causes a compiler syntax error. This is not a bug, but is a defect in the code which the compiler catches and which is immediately repaired. Not all defects are so easy to fix, but it leads to the idea that while all bugs are defects, not all defects are bugs.
Scrum Sprint Planning
Once the needed inputs to the process are complete, the Srpint Planning process can begin.
Inputs To the Planning Process
There are a number of inputs to the planning meeting:
- A groomed and prioritized backlog
- Estimates for the highest-priority user stories
- The team's velocity number has been calculated
- The team's definition of
done
has been decided - The schedule of the sprint is completed [including such things as holidats, vacation, or company functions that might affect the amount of work to which the team can commit]
- Any other inputs that may affect the team [such as infrastructure issues]
The Planning Session
The Sprint planning meeting has two distinct things that must be achieved. First, there needs to be an assurance that the entire team has a complete understanding of all the user stories, and of all the tasks involved for this sprint. Second, the team must be allowed to break the work down into the small individual tasks, and to determine which team member will do which task, to support the principle of self-organizing. The process has four basic steps:
- Once the user stories are understood, the team can decide how many of them can be part of this sprint.
- The team then breaks the user stories down into individual tasks. Each story may contain several distinct parts, and each of those individual parts can be owned by different developers depending upon their level of expertise.
- Each team member picks the tasks s/he wants to work on, and is willing to commit to completing. The team members make their own selection[s] as has been previously mentioned. This creates the ability to cross-train or develop new skills.
- The team members the estimate – in hours – the amount of time it will take to complete each task for which they have responsibility. The team might add some time to their estimates if the developer is new on that particular part of the project, to allow for the learning curve.
Note that it is during this meeting that the story points are converted to the actual hours needed for making the actual estimate. This function is delayed to this point, since this is when the appropriate level of detail ia actually granular enough to provide confidence in the estimates that result.
Output from the Planning Process
There are two primary outputs from the Sprint planning meeting. First is the Sprint goal, which is the list of user stories to which the team has committed for this sprint. Second is the Sprint backlog, the list of tasks and their owners, for the purpose of tracking progress.
XP Planning
XP uses a similar
ritual
to that of Scrum, called theplanning game
. It has two parts: release planning, which is similar to backlog grooming; and iteration planning, which is aligned with Sprint planning. Each of these meetings has three distinct phases in XP as is shown in the following table.Metadata Release Planning Iteration Planning Description Determine what requirements will be included in the upcoming
release[s] and the planned delivery datesOutline the specific tasks and commitment by the members of the development team Participants Customers and Developers Developers ONLY Exploration Phase Customer provides highest-priority feature requests
[user stories]Requirements are converted to individual tasks Commitment phase Team determines what functionality will be included and
commits to due datesTasks are assigned and estimates are refined; deliverable is committed to Steering Phase Plan is reviewed and can be adjusted, if needed, to add or
remove storiesTasks are performed and deliverable is compared to original feature request for completeness [From Ashmore, p. 168]
It is important to realize that the participants have different activities for which they are responsible. The customers are most qualified to say what is important, so they are the ones to prioritize. The programmers are most qualified to determine durations, so they estimate. Neither of the groups operate in a vacuum; they must work together to do the planning so that it makes sense.
Maintenance of Legacy Code
In many organizations, Agile teams are asked to maintain the software after the product has been done and deployed. This
maintenance phase
is notsexy
, so many of the developers will resist having to be involved with it. However, it is a critical part of the entire project, especially when you consider that 75% of the cost of every project is consumed by maintenance activities.Build Time into the Sprint
The most common way that teams handle the unpredictability of maintenance issues is to build time into the schedule for them. Time can be reserved in each sprint so that the team can handle defects from the previous sprint. Sometimes the defects can account for more than the allotted time, of course, but overall on average, the team learns from their rhythm and builds in enough time reserves to handle what may arise.
Assign a Team Resource to Maintenance
In some Agile teams, rather than allocating time that EVERY developer needs to use for maintenance work, some individual resource can be assigned to handle the unexpected. This can even be a rotating role on the team, so that no one person is always
IT
. This person may have little to no development tasks during the sprint when they are responsible for maintenance, so that they are always available. It may even be that they get off lightly if during their sprint there are no defects to rectify, so that they can offload some of the work of the other team members.Split the Team in Two
In the case of a large team, another option which is available is to split the team into two smaller teams. In this case, it might be that one team is slightly smaller than the other and is responsible for testing and debugging, while the other team does development. Or, the teams may be the same size. The assignments can even be reversed on alternating sprints, as long as all team members on both teams understand the product fully enough to be effective on either team; this can help one team or the other to keep from burning out.
Triple Constraints
A long-standing project management adage says that projects comprise three variables: Schedule/time, cost/resources, and scope/quality. Actually it is complicated in this description by including two separate things with each of the three variables. More commonly the
holy trinity
[as I like to call it] is really more focused on the things in front of the slashes: Cost, Schedule, and Scope [which can also be referred to asfunctionality
]. The problem is that you cannot adjust one of these parameters without affecting the other two. If the schedule begins to run long, for example, the cost will increase due to the increased time duration that the team is working on the project.However, with Agile, the perspective is different. Agile disconnects scope and quality, since the team may produce what is actually asked for but with poor quality [or the opposite]. This means that Agile actually has four variables instead of three from that viewpoint.
Another way to look at this is to view resources and time as fixed quantities, so the only thing that is really
variable
is the scope. This simplifies things considerably, since the only variable needing to be managed is the amount of functionality that goes into each sprint.What about Kanban?
When it comes to planning and execution, Kanban follows a practice that is so different from Scrum that it really doesn't fit with this discussion. We will deal with it later in the semester!
In-class Exercise #1
Here are the velocity numbers for two teams:
Sprint # Team 1
Completed PointsTeam 2
Completed Points1 15 5 1 20 11 1 18 6 1 14 12 1 16 14 1 24 20 1 19 24 Velocity ?? ?? Calculate the velocity of team 1 using the averages for all the data points. Then Calculate the velocity for team 2 using
yesterday's weather
by including only the last two sprints. Which team has the higher productivity? what are some of the reasons that the velocity on team 1 might drop to 10 on the next sprint?In-class Exercise #2
In the online tool PlanningPoker.com, I have created a project that has several user stories. If they look familiar, it is because they are the child stories from the web page for week 7. The child stories are broken down from the epic on that same page; however, they may still seem to be too large to be a valid user story.
The exercise is as follows:
- Get into your team grouping.
- Go to the website and create an account for your group. You only need one account for the whole group for this demonstration.
- When your account is created, let me know and I'll invite you to my game
- Once everyone is in the game, there are four user stories which will be addressed.
- We will play a couple of rounds of planning poker online using the tool to see how it goes.
- The learning outcome for this exercise is that you will have some experience with playing planning poker, as well as a common on-line tool for estimating using this method.
Note that the free version of the tool only allows 5 players, so there will have to be two teams that will need to work together. Note also that I'm learning about this interface with you, so it's going to be an experiment for all of us!
Coming up…
Gorsh, what's next!!!????
TESTING AND INTEGRATION!!!